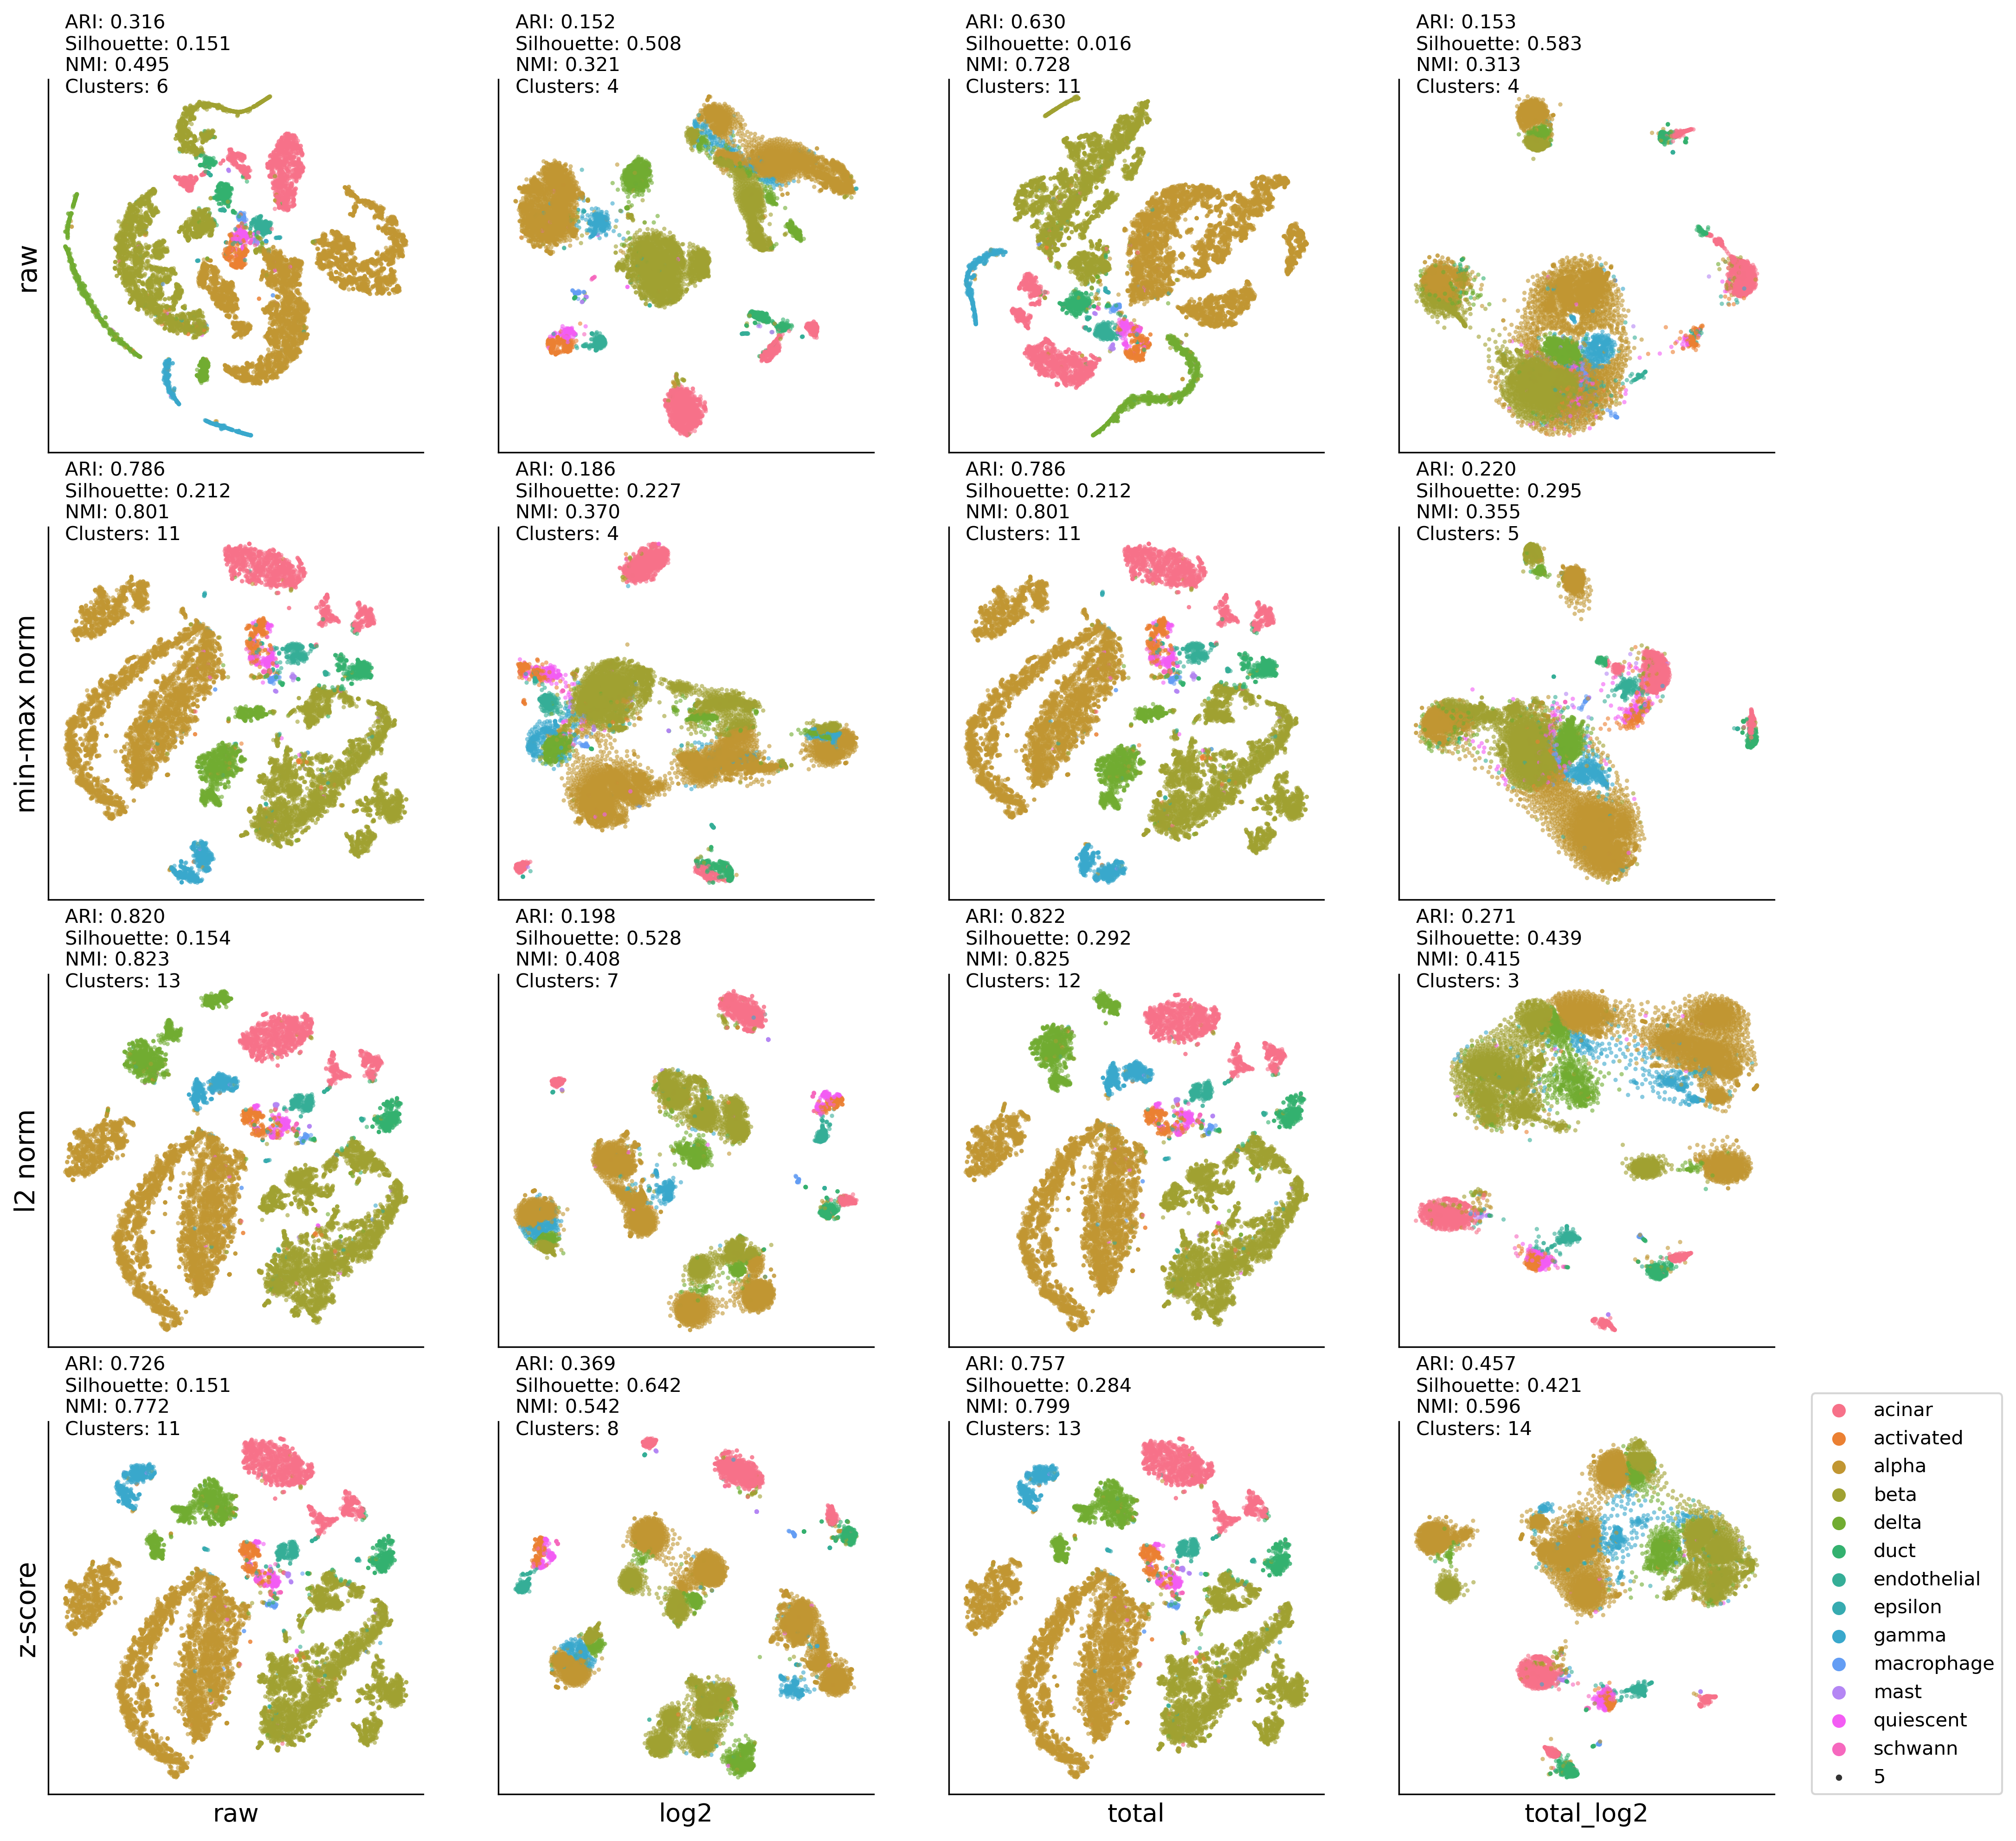
4. Low-dimensional integration analysis of pancreas dataset#
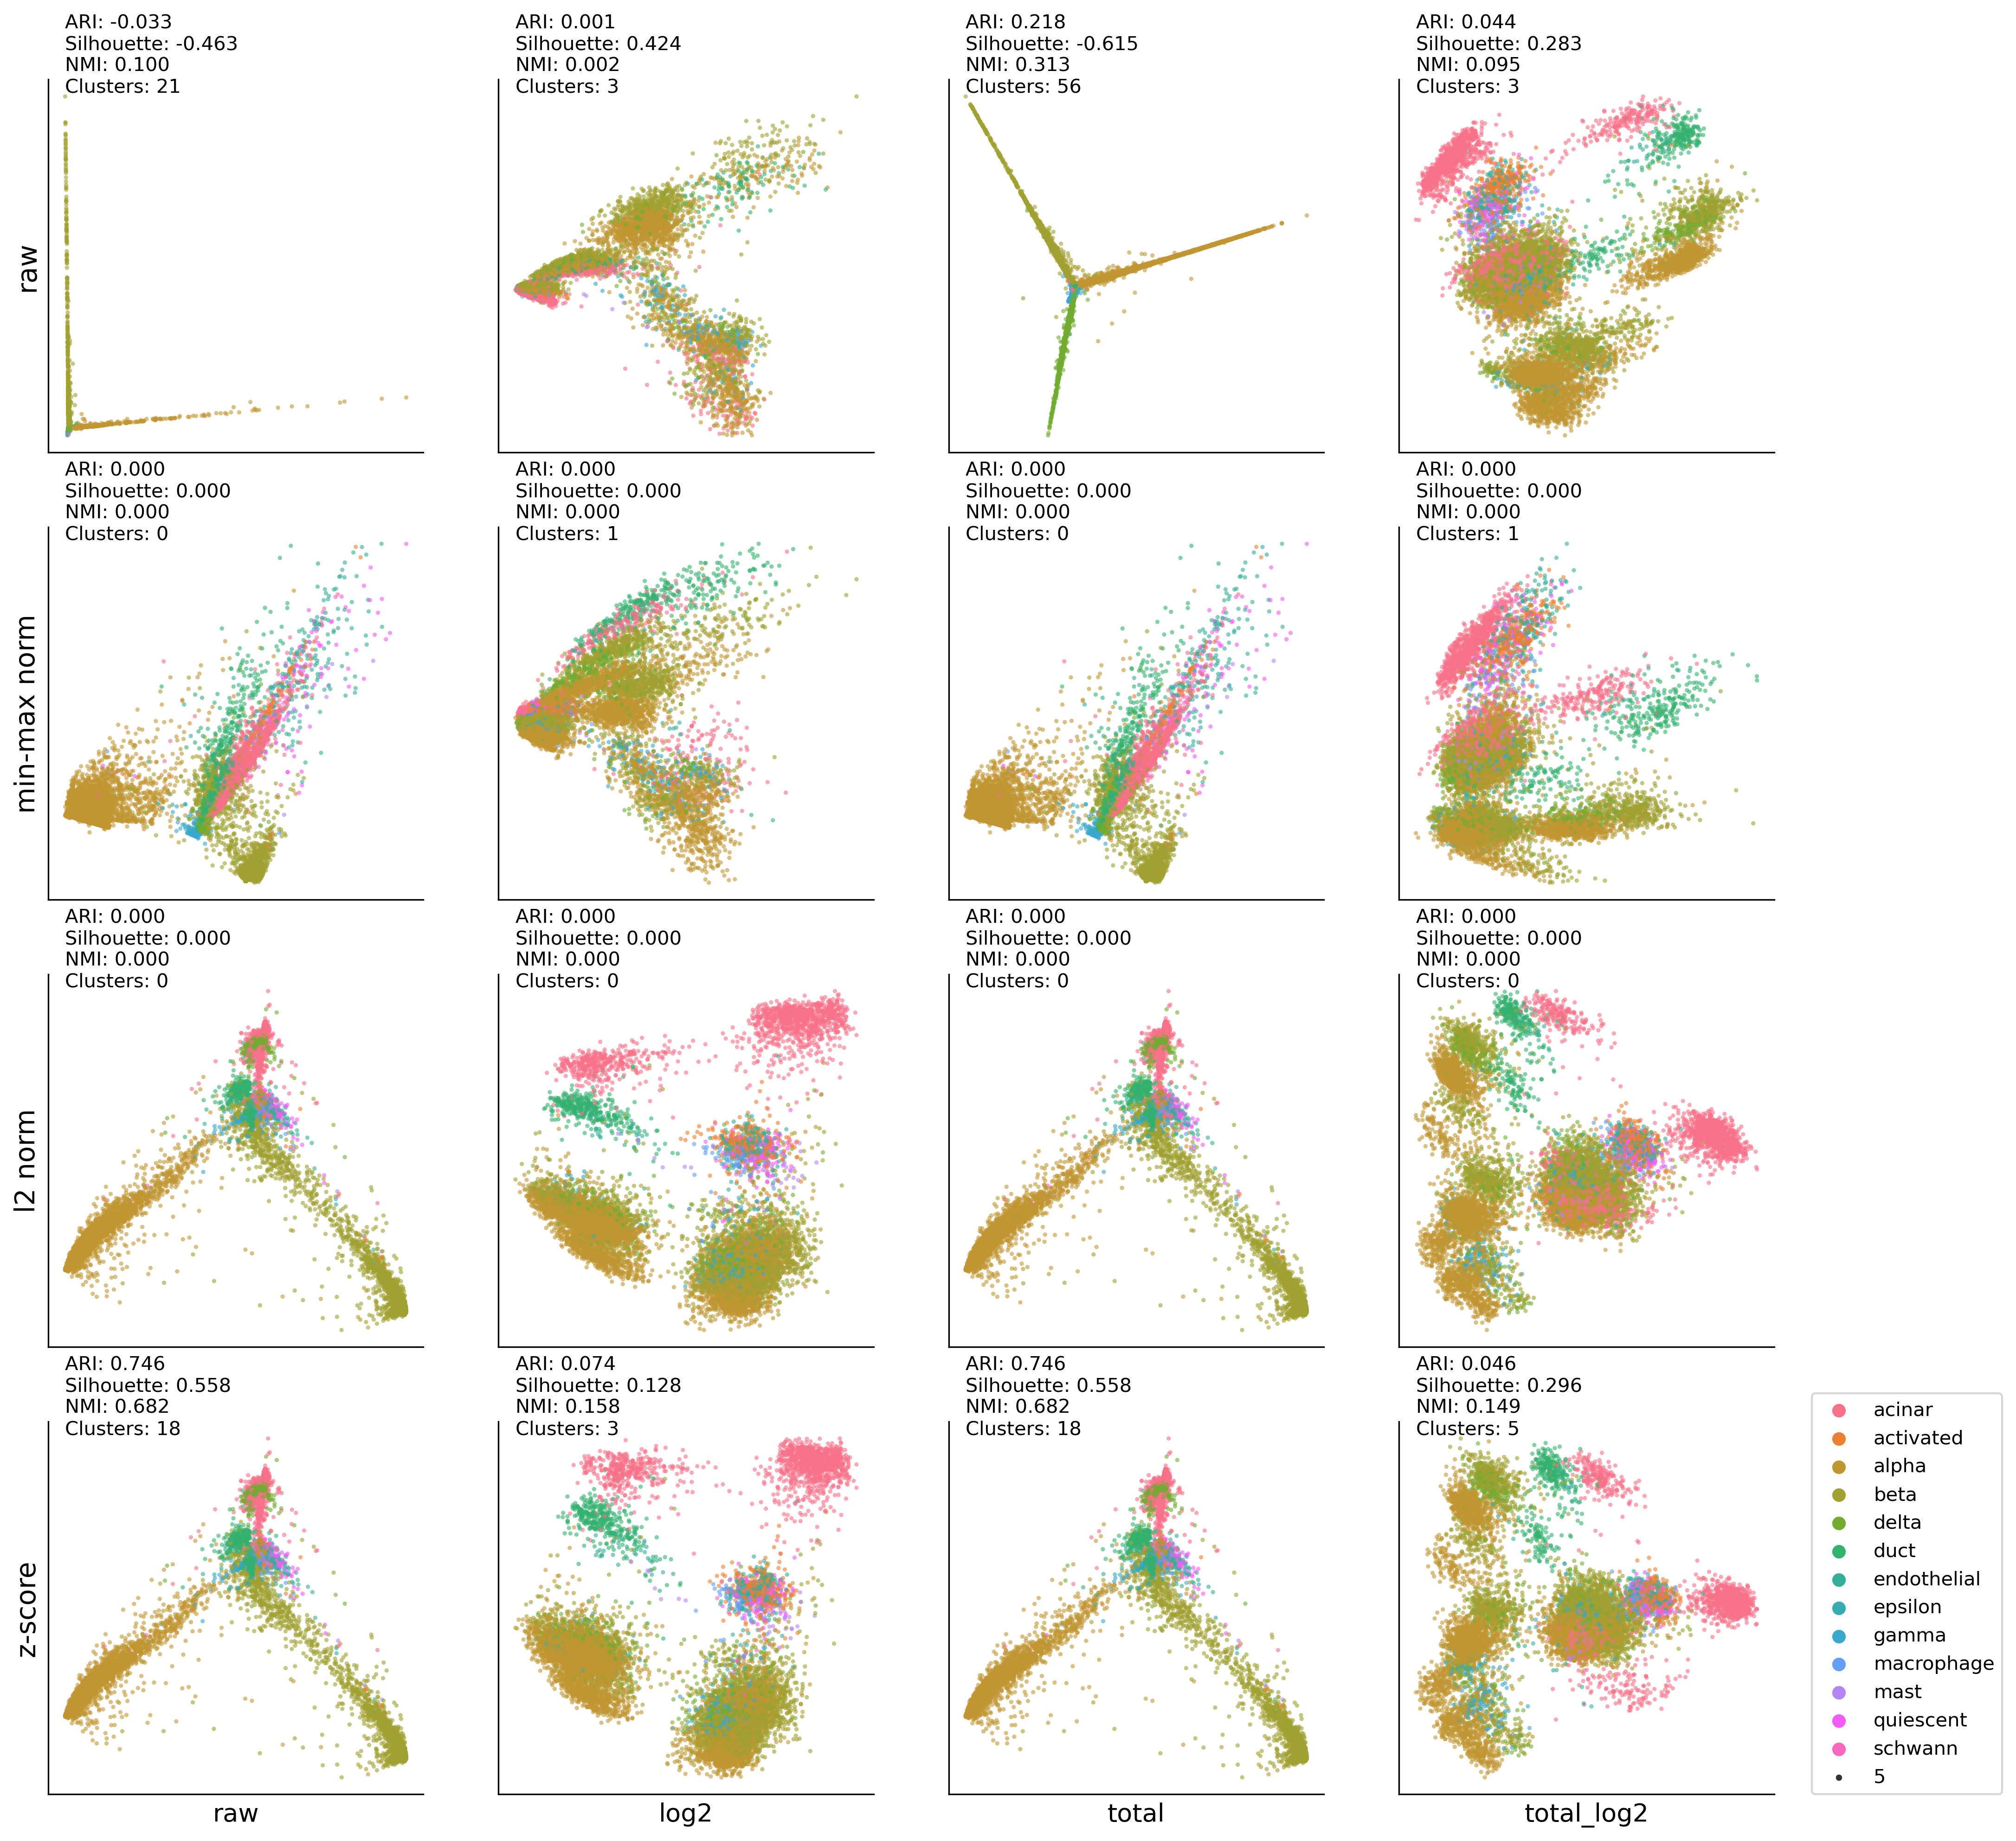
HP-UMAP:DBSCAN results#
import matplotlib.pyplot as plt
from umap import UMAP
from utils import run_plot
import src.utils as my_u
from src.utils import df_cp
from src.utils import df_log
from src.utils import df_total20000
from src.utils import df_minmax
from src.utils import df_l2norm
from src.utils import df_zscore
from src.utils import df_meansquare
from src.utils import run_plot

total_data = X_
labels = y_

latent_space = umap.UMAP(n_components=2, init='spectral', random_state=0)
clustering_method = 'dbscan'

############################################
plt.figure(figsize=(16,16), dpi=300)
ax00 = plt.subplot2grid((4,4), (0,0))
ax10 = plt.subplot2grid((4,4), (0,1))
ax20 = plt.subplot2grid((4,4), (0,2))
ax30 = plt.subplot2grid((4,4), (0,3))

ax01 = plt.subplot2grid((4,4), (1,0))
ax11 = plt.subplot2grid((4,4), (1,1))
ax21 = plt.subplot2grid((4,4), (1,2))
ax31 = plt.subplot2grid((4,4), (1,3))

ax02 = plt.subplot2grid((4,4), (2,0))
ax12 = plt.subplot2grid((4,4), (2,1))
ax22 = plt.subplot2grid((4,4), (2,2))
ax32 = plt.subplot2grid((4,4), (2,3))

ax03 = plt.subplot2grid((4,4), (3,0))
ax13 = plt.subplot2grid((4,4), (3,1))
ax23 = plt.subplot2grid((4,4), (3,2))
ax33 = plt.subplot2grid((4,4), (3,3))

############################################
latent_space = UMAP(n_components=2, init='spectral', random_state=0)
run_plot((total_data), \
         ax00, labels, latent_space, clustering_method)
latent_space = UMAP(n_components=2, init='spectral', random_state=0)
run_plot(df_log((total_data)), \
         ax10, labels, latent_space, clustering_method)
latent_space = UMAP(n_components=2, init='spectral', random_state=0)
run_plot(df_total20000((total_data)), \
         ax20, labels, latent_space, clustering_method)
latent_space = UMAP(n_components=2, init='spectral', random_state=0)
run_plot(df_log(df_total20000((total_data))), \
         ax30, labels, latent_space, clustering_method)
############################################
latent_space = UMAP(n_components=2, init='spectral', random_state=0)
run_plot(df_minmax(df_cp(total_data)), \
         ax01, labels, latent_space, clustering_method)
latent_space = UMAP(n_components=2, init='spectral', random_state=0)
run_plot(df_minmax(df_log(df_cp(total_data))), \
         ax11, labels, latent_space, clustering_method)
latent_space = UMAP(n_components=2, init='spectral', random_state=0)
run_plot(df_minmax(df_total20000(df_cp(total_data))), \
         ax21, labels, latent_space, clustering_method)
latent_space = UMAP(n_components=2, init='spectral', random_state=0)
run_plot(df_minmax(df_log(df_total20000(df_cp(total_data)))), \
         ax31, labels, latent_space, clustering_method)
############################################
latent_space = UMAP(n_components=2, init='spectral', random_state=0)
run_plot(df_l2norm(df_cp(total_data)), \
         ax02, labels, latent_space, clustering_method)
latent_space = UMAP(n_components=2, init='spectral', random_state=0)
run_plot(df_l2norm(df_log(df_cp(total_data))), \
         ax12, labels, latent_space, clustering_method)
latent_space = UMAP(n_components=2, init='spectral', random_state=0)
run_plot(df_l2norm(df_total20000(df_cp(total_data))), \
         ax22, labels, latent_space, clustering_method)
latent_space = UMAP(n_components=2, init='spectral', random_state=0)
run_plot(df_l2norm(df_log(df_total20000(df_cp(total_data)))), \
         ax32, labels, latent_space, clustering_method)
############################################
latent_space = UMAP(n_components=2, init='spectral', random_state=0)
run_plot(df_zscore(df_cp(total_data)), \
         ax03, labels, latent_space, clustering_method)
latent_space = UMAP(n_components=2, init='spectral', random_state=0)
run_plot(df_zscore(df_log(df_cp(total_data))), \
         ax13, labels, latent_space, clustering_method)
latent_space = UMAP(n_components=2, init='spectral', random_state=0)
run_plot(df_zscore(df_total20000(df_cp(total_data))), \
         ax23, labels, latent_space, clustering_method)
latent_space = UMAP(n_components=2, init='spectral', random_state=0)
run_plot(df_zscore(df_log(df_total20000(df_cp(total_data)))), \
         ax33, labels, latent_space, clustering_method)
############################################
ax00.set_ylabel('raw' , fontsize=14)
ax01.set_ylabel('min-max norm' , fontsize=14)
ax02.set_ylabel('l2 norm' , fontsize=14)
ax03.set_ylabel('z-score' , fontsize=14)

ax03.set_xlabel('raw', fontsize=13)
ax13.set_xlabel('log2', fontsize=13)
ax23.set_xlabel('total', fontsize=13)
ax33.set_xlabel('total_log2', fontsize=13)
ax33.legend(bbox_to_anchor=(1.1,0), loc='lower left',borderaxespad=0)
<matplotlib.legend.Legend at 0x7fc1b5f73520>
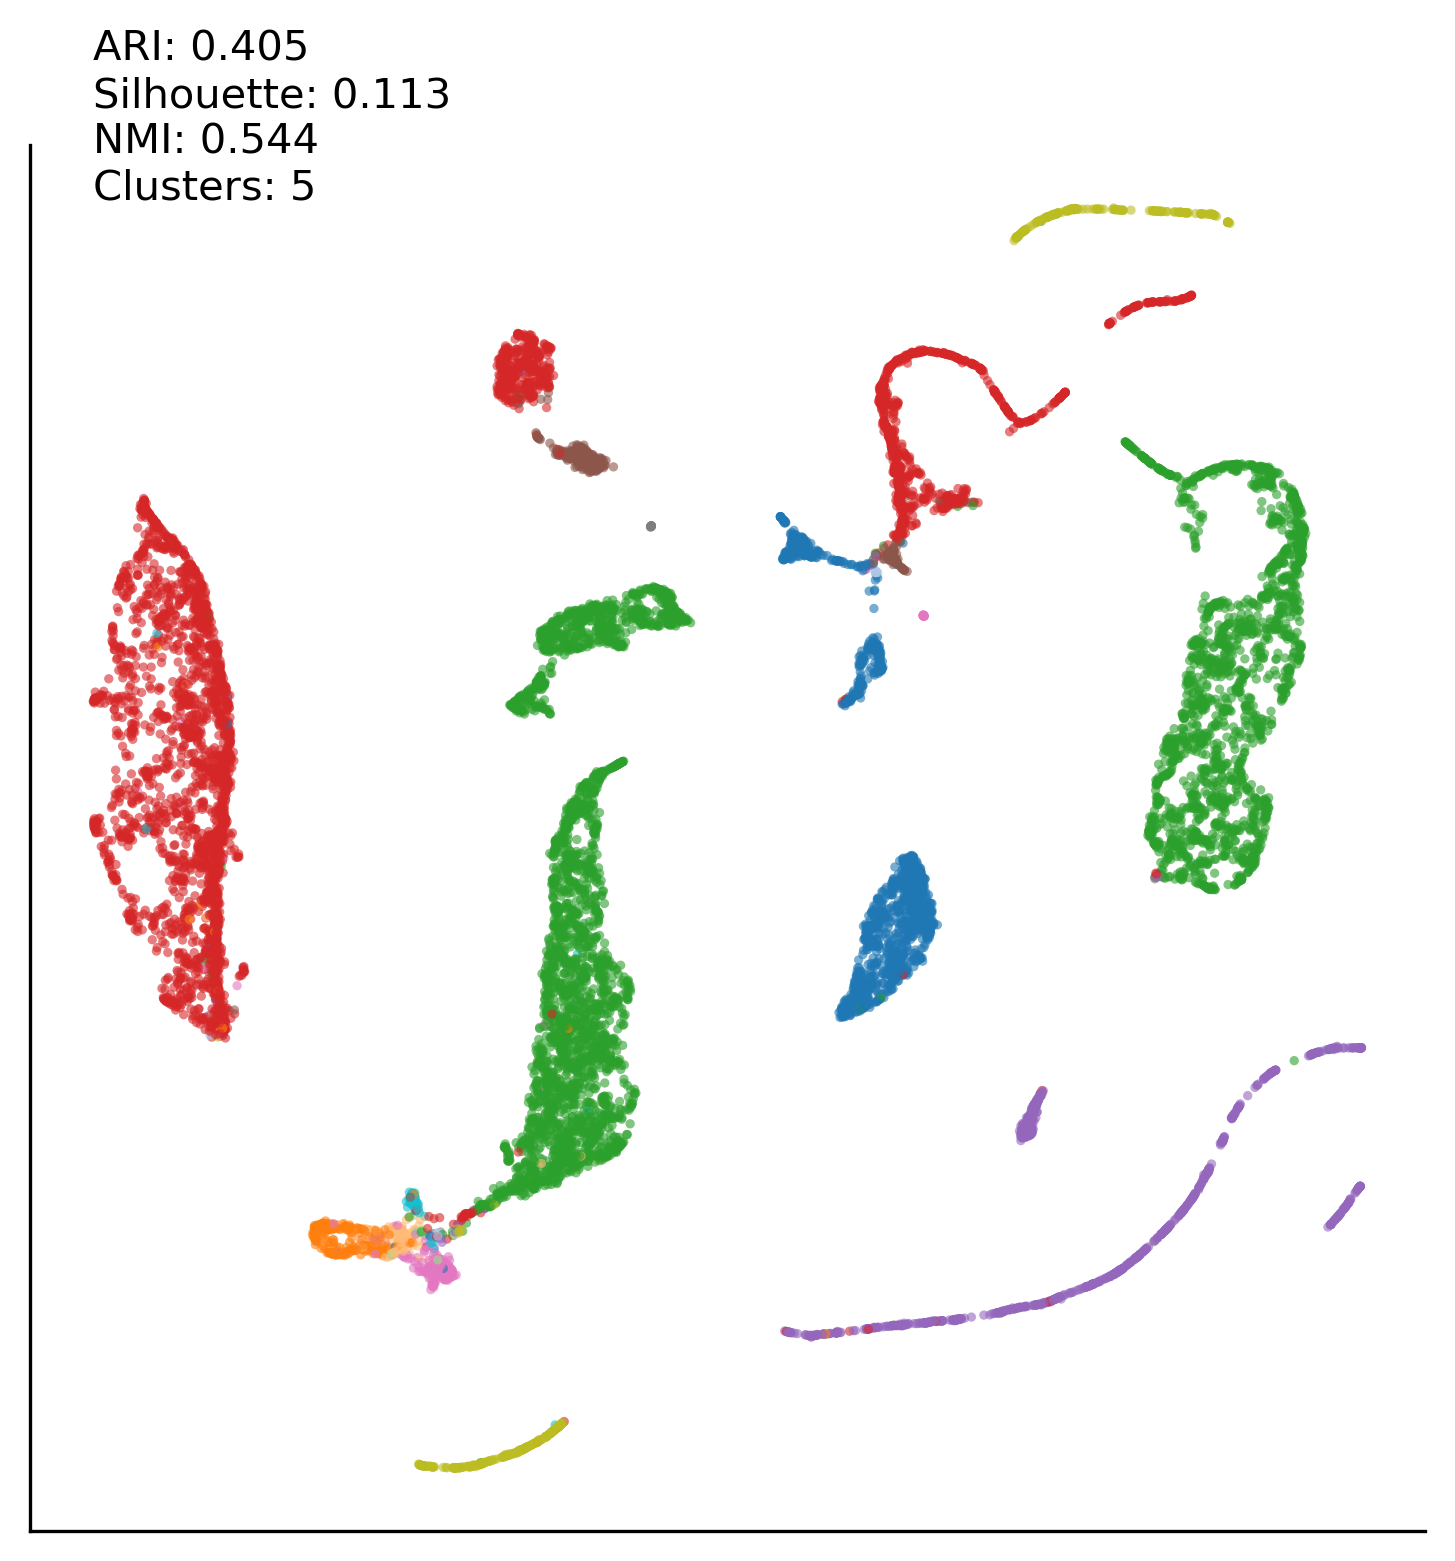
Raw:UMAP:DBSCAN case#
import matplotlib.pyplot as plt
from umap import UMAP
import src.utils as my_u
from src.utils import df_cp
from src.utils import df_total20000
from src.utils import run_plot


total_data = X_
labels = y_

latent_space = umap.UMAP(n_components=2, init='spectral', random_state=0)
clustering_method = 'dbscan'

plt.figure(figsize=(6,6), dpi=300)
ax00 = plt.subplot2grid((1,1), (0,0))

latent_space = UMAP(n_components=2, init='spectral', random_state=0)
with sns.color_palette(vega_20[::2]+vega_20[1::2]):
    run_plot(total_data, \
         ax00, labels, latent_space, clustering_method)
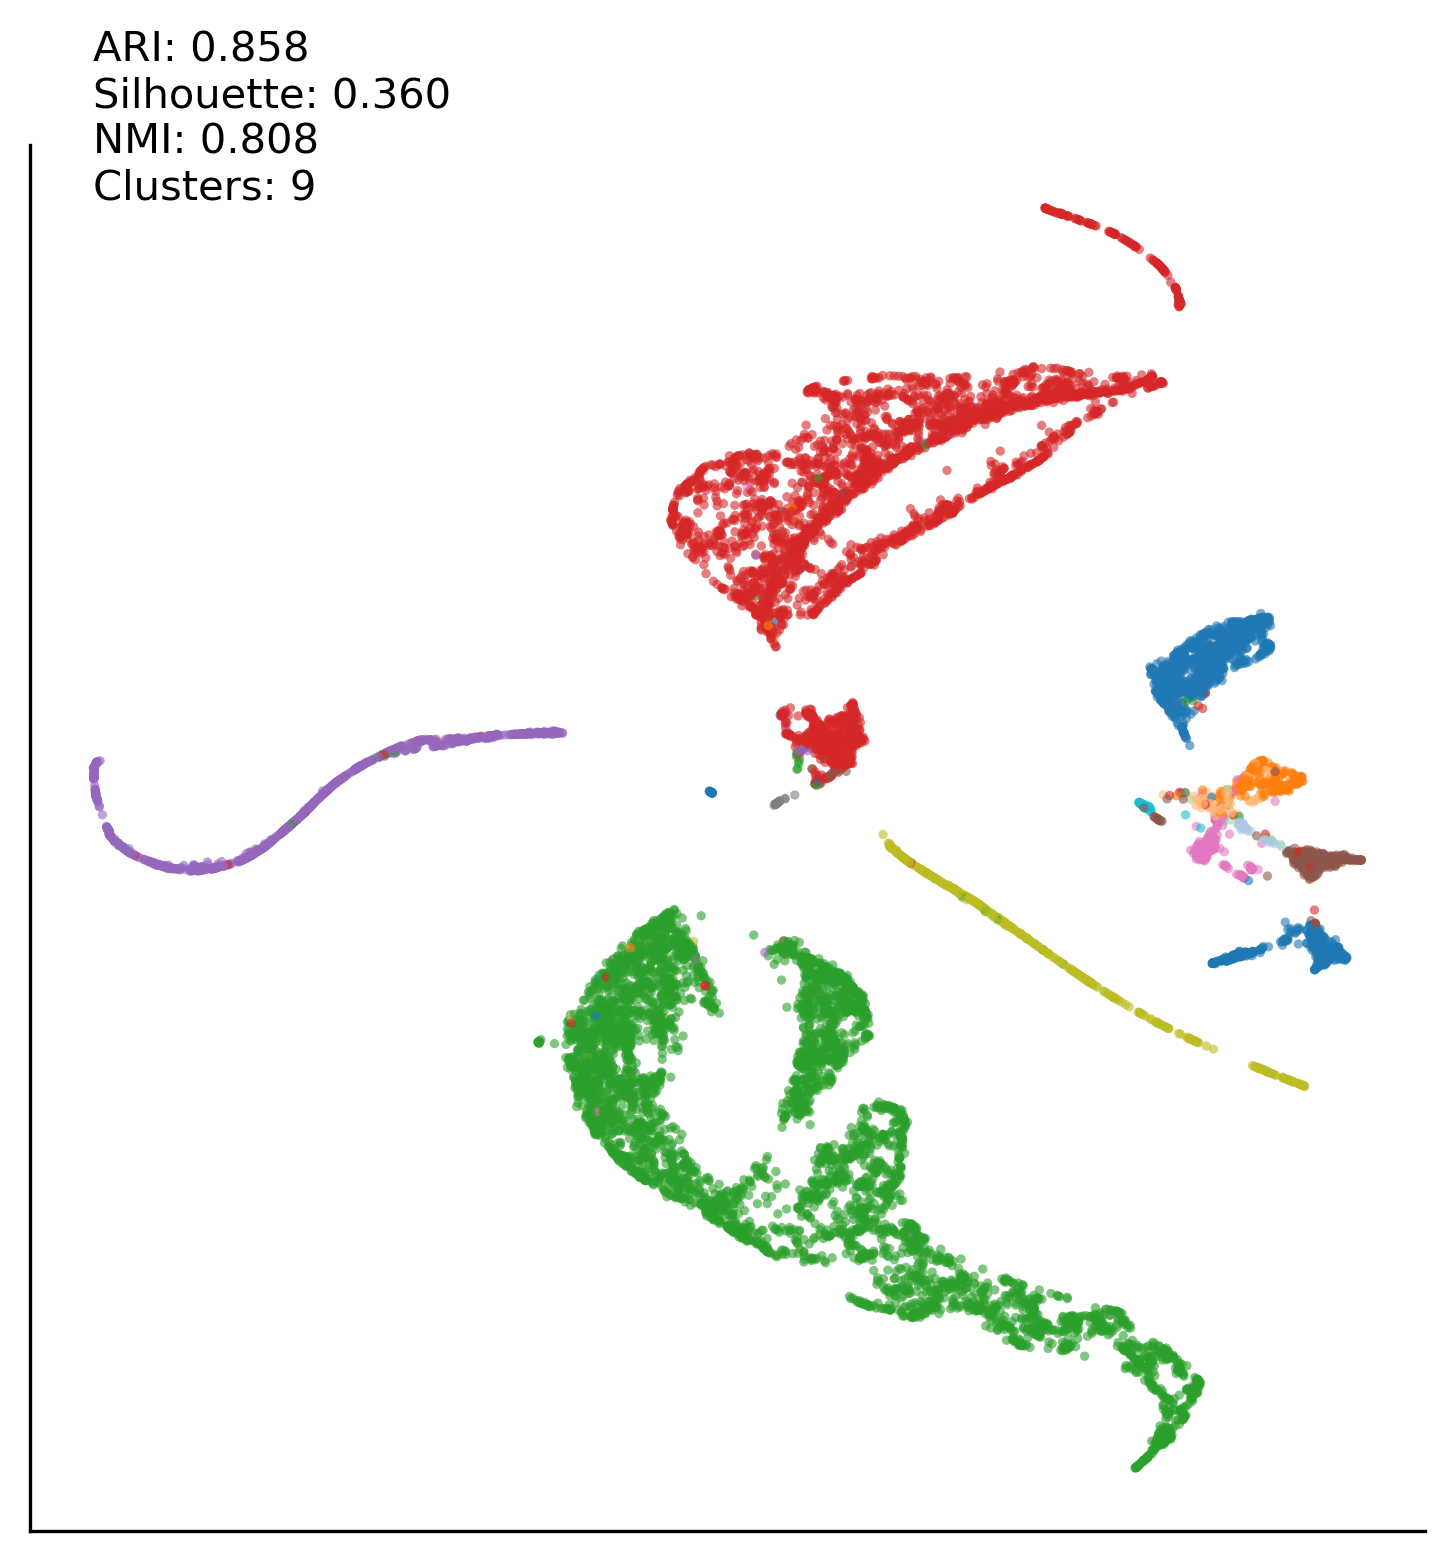
Total:UMAP:DBSCAN case#
import matplotlib.pyplot as plt
from umap import UMAP
import src.utils as my_u
from src.utils import df_cp
from src.utils import df_total20000
from src.utils import run_plot


total_data = X_
labels = y_

latent_space = umap.UMAP(n_components=2, init='spectral', random_state=0)
clustering_method = 'dbscan'

plt.figure(figsize=(6,6), dpi=300)
ax00 = plt.subplot2grid((1,1), (0,0))

latent_space = UMAP(n_components=2, init='spectral', random_state=0)
with sns.color_palette(vega_20[::2]+vega_20[1::2]):
    run_plot(df_total20000((total_data)), \
         ax00, labels, latent_space, clustering_method)
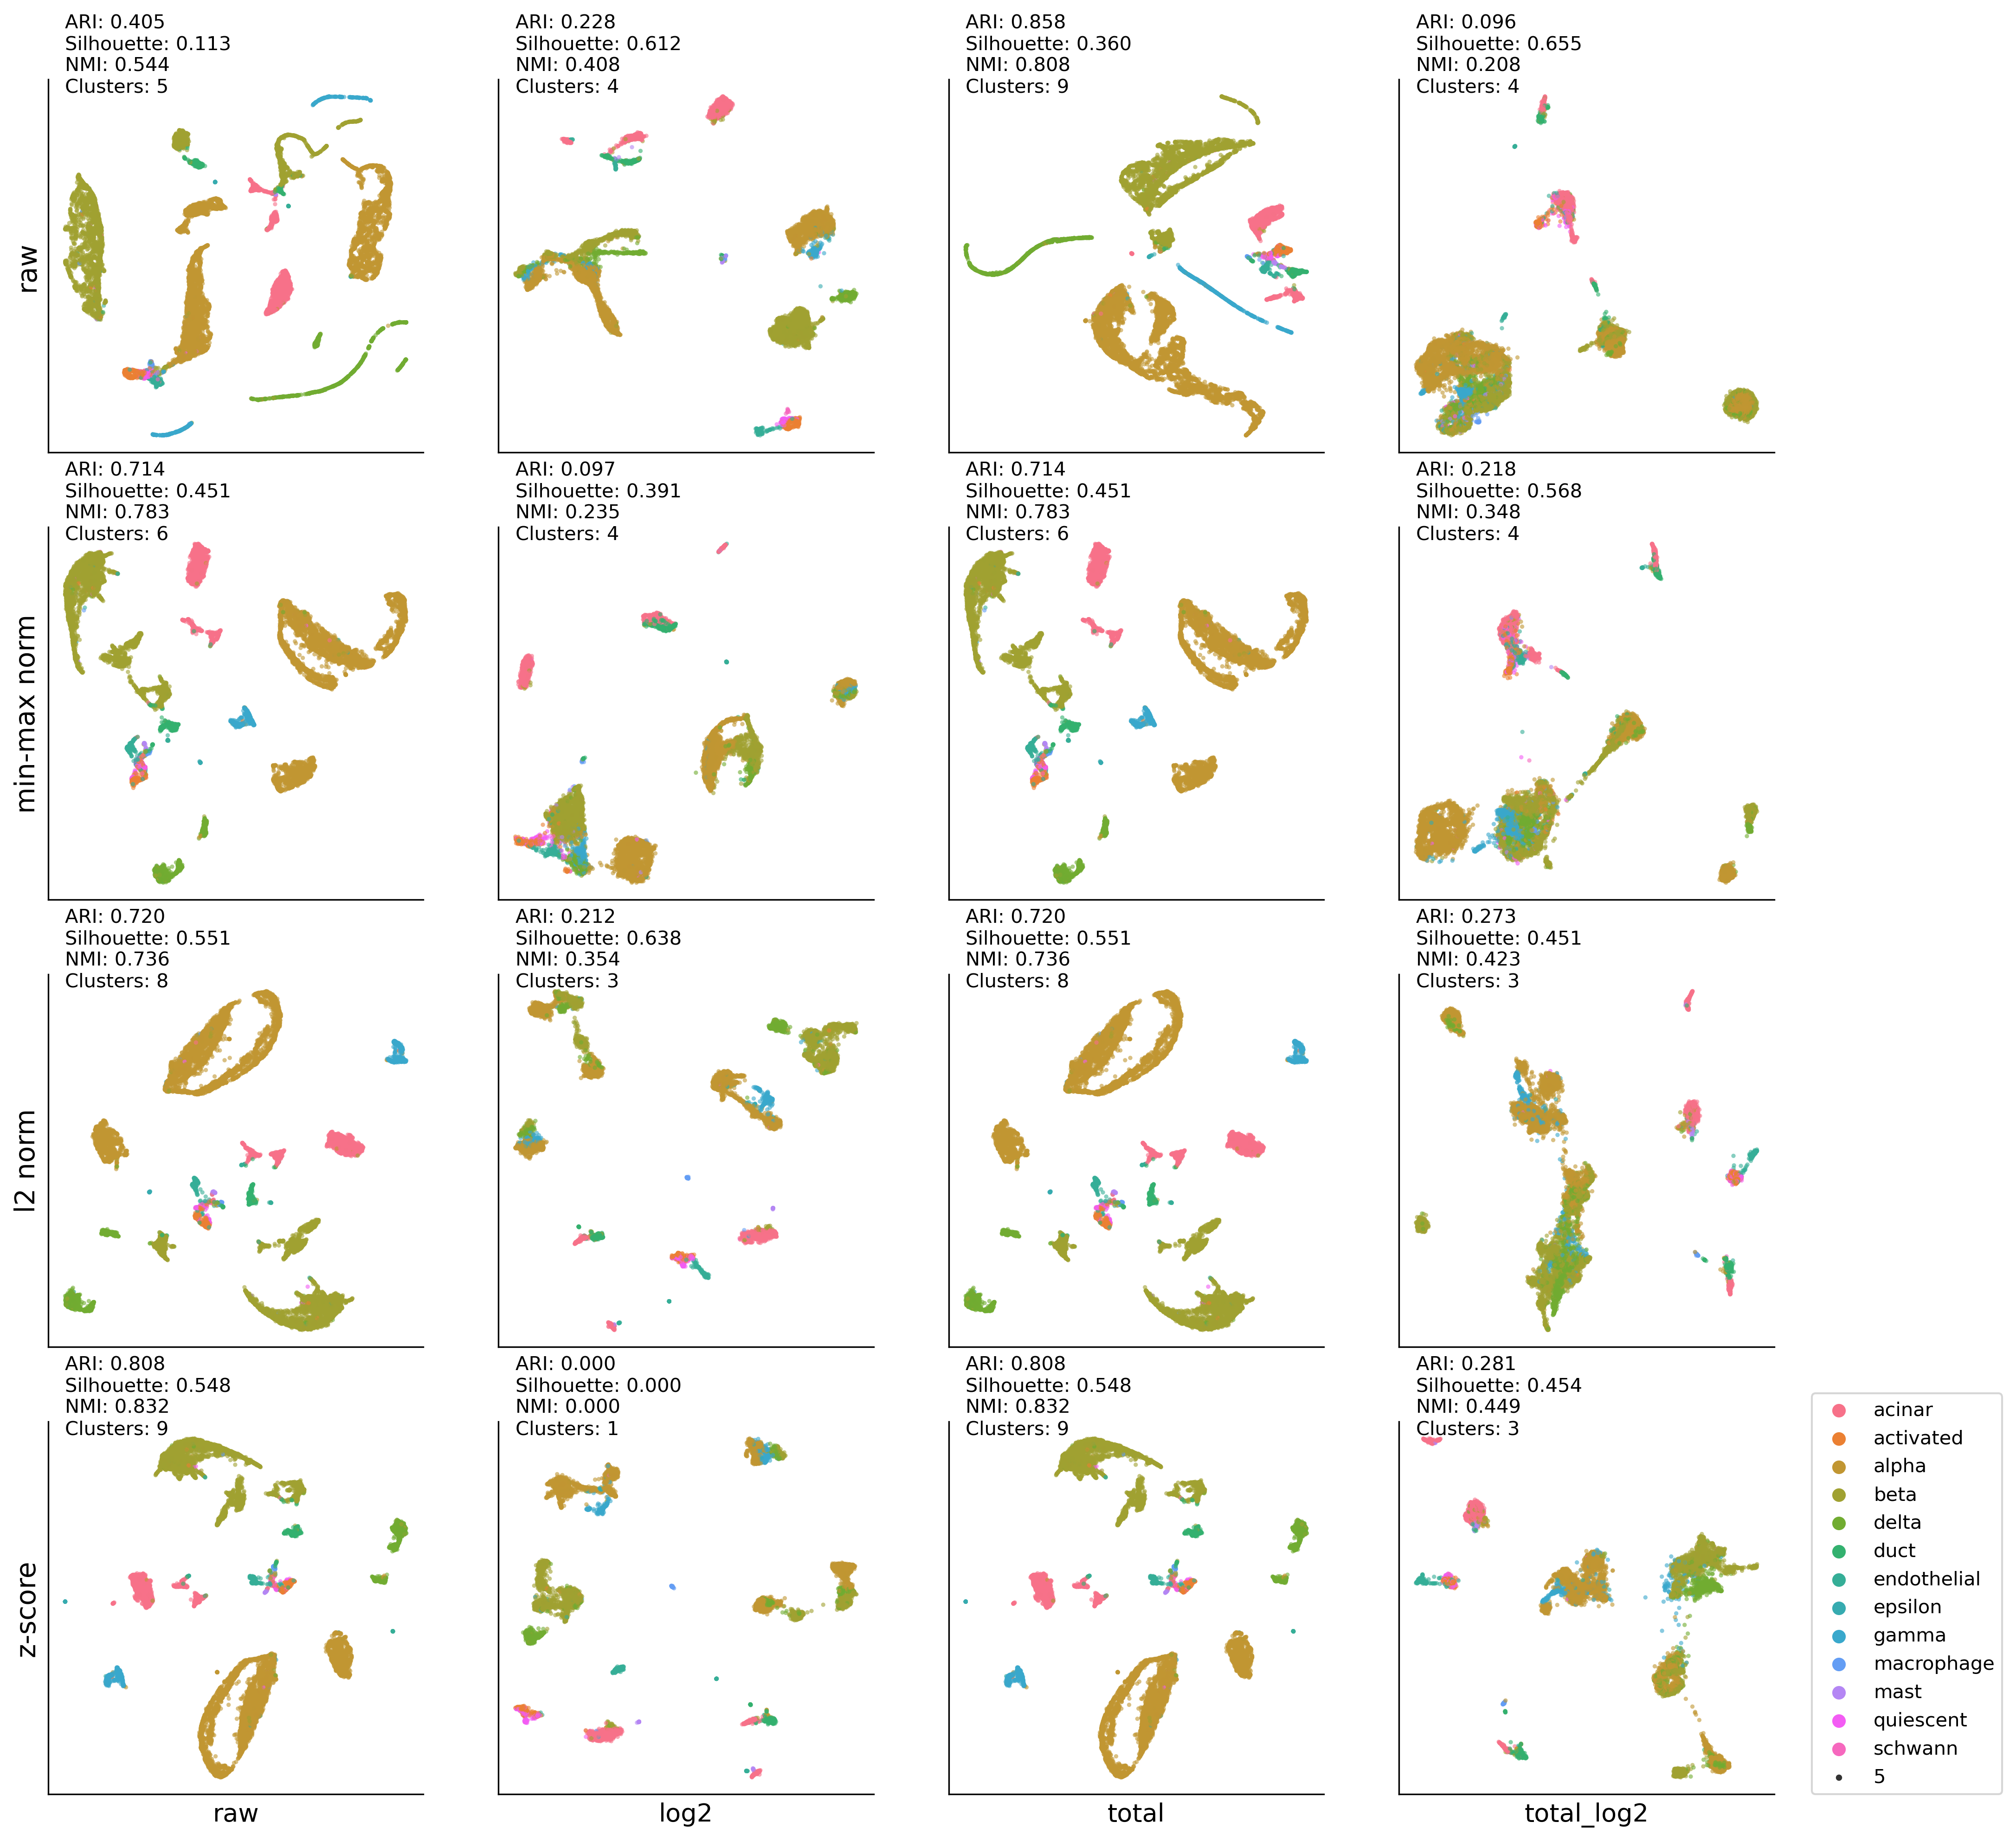
HP-PCA:DBSCAN results#
import matplotlib.pyplot as plt
from sklearn.decomposition import PCA
from utils import run_plot
import src.utils as my_u
from src.utils import df_cp
from src.utils import df_log
from src.utils import df_total20000
from src.utils import df_minmax
from src.utils import df_l2norm
from src.utils import df_zscore
from src.utils import df_meansquare
from src.utils import run_plot

total_data = X_
labels = y_

latent_space = PCA(n_components=2, random_state=0)
clustering_method = 'dbscan'

############################################
plt.figure(figsize=(16,16), dpi=300)
ax00 = plt.subplot2grid((4,4), (0,0))
ax10 = plt.subplot2grid((4,4), (0,1))
ax20 = plt.subplot2grid((4,4), (0,2))
ax30 = plt.subplot2grid((4,4), (0,3))

ax01 = plt.subplot2grid((4,4), (1,0))
ax11 = plt.subplot2grid((4,4), (1,1))
ax21 = plt.subplot2grid((4,4), (1,2))
ax31 = plt.subplot2grid((4,4), (1,3))

ax02 = plt.subplot2grid((4,4), (2,0))
ax12 = plt.subplot2grid((4,4), (2,1))
ax22 = plt.subplot2grid((4,4), (2,2))
ax32 = plt.subplot2grid((4,4), (2,3))

ax03 = plt.subplot2grid((4,4), (3,0))
ax13 = plt.subplot2grid((4,4), (3,1))
ax23 = plt.subplot2grid((4,4), (3,2))
ax33 = plt.subplot2grid((4,4), (3,3))

############################################
run_plot((total_data), \
         ax00, labels, latent_space, clustering_method)
run_plot(df_log((total_data)), \
         ax10, labels, latent_space, clustering_method)
run_plot(df_total20000((total_data)), \
         ax20, labels, latent_space, clustering_method)
run_plot(df_log(df_total20000((total_data))), \
         ax30, labels, latent_space, clustering_method)
############################################
run_plot(df_minmax(df_cp(total_data)), \
         ax01, labels, latent_space, clustering_method)
run_plot(df_minmax(df_log(df_cp(total_data))), \
         ax11, labels, latent_space, clustering_method)
run_plot(df_minmax(df_total20000(df_cp(total_data))), \
         ax21, labels, latent_space, clustering_method)
run_plot(df_minmax(df_log(df_total20000(df_cp(total_data)))), \
         ax31, labels, latent_space, clustering_method)
############################################
run_plot(df_l2norm(df_cp(total_data)), \
         ax02, labels, latent_space, clustering_method)
run_plot(df_l2norm(df_log(df_cp(total_data))), \
         ax12, labels, latent_space, clustering_method)
run_plot(df_l2norm(df_total20000(df_cp(total_data))), \
         ax22, labels, latent_space, clustering_method)
run_plot(df_l2norm(df_log(df_total20000(df_cp(total_data)))), \
         ax32, labels, latent_space, clustering_method)
############################################
run_plot(df_zscore(df_cp(total_data)), \
         ax03, labels, latent_space, clustering_method)
run_plot(df_zscore(df_log(df_cp(total_data))), \
         ax13, labels, latent_space, clustering_method)
run_plot(df_zscore(df_total20000(df_cp(total_data))), \
         ax23, labels, latent_space, clustering_method)
run_plot(df_zscore(df_log(df_total20000(df_cp(total_data)))), \
         ax33, labels, latent_space, clustering_method)
############################################
ax00.set_ylabel('raw' , fontsize=14)
ax01.set_ylabel('min-max norm' , fontsize=14)
ax02.set_ylabel('l2 norm' , fontsize=14)
ax03.set_ylabel('z-score' , fontsize=14)

ax03.set_xlabel('raw', fontsize=13)
ax13.set_xlabel('log2', fontsize=13)
ax23.set_xlabel('total', fontsize=13)
ax33.set_xlabel('total_log2', fontsize=13)
ax33.legend(bbox_to_anchor=(1.1,0), loc='lower left',borderaxespad=0)
<matplotlib.legend.Legend at 0x7fddd1d24f10>
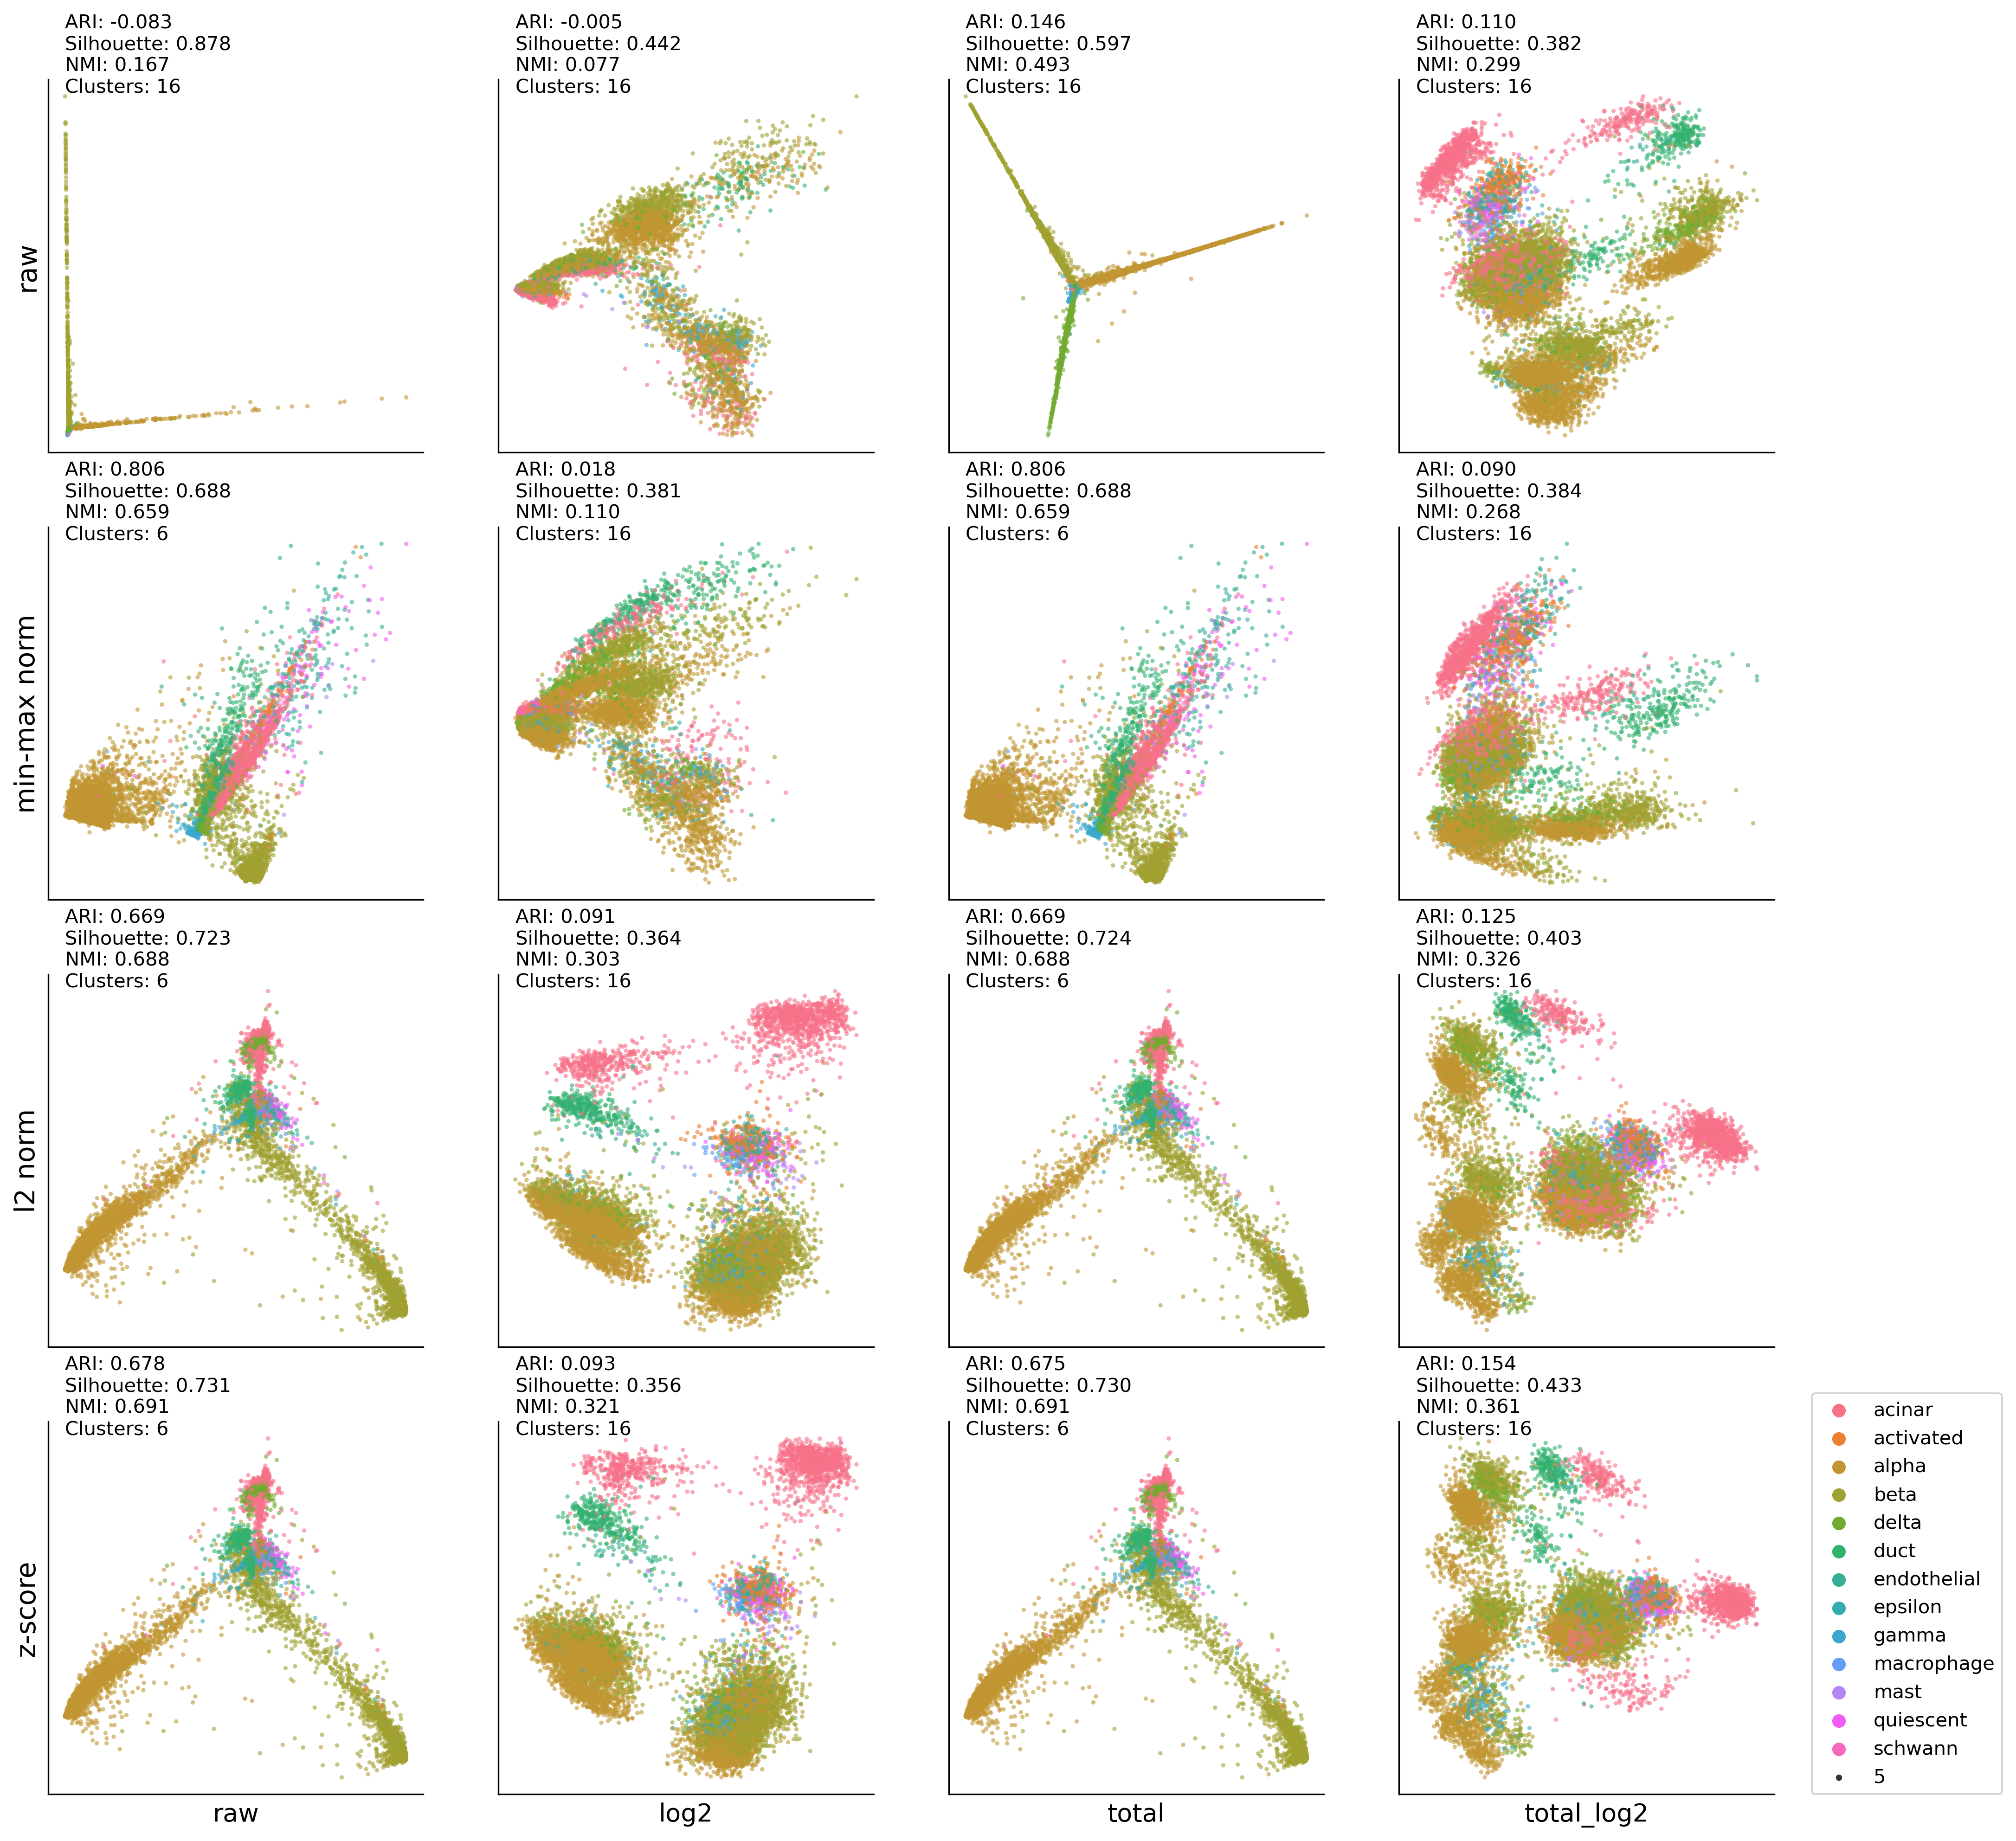
HP-UMAP:KMEAN results#
import matplotlib.pyplot as plt
from sklearn.decomposition import PCA
from utils import run_plot
import src.utils as my_u
from src.utils import df_cp
from src.utils import df_log
from src.utils import df_total20000
from src.utils import df_minmax
from src.utils import df_l2norm
from src.utils import df_zscore
from src.utils import df_meansquare
from src.utils import run_plot

total_data = X_
labels = y_

latent_space = PCA(n_components=2, random_state=0)
clustering_method = 'kmean'

############################################
plt.figure(figsize=(16,16), dpi=300)
ax00 = plt.subplot2grid((4,4), (0,0))
ax10 = plt.subplot2grid((4,4), (0,1))
ax20 = plt.subplot2grid((4,4), (0,2))
ax30 = plt.subplot2grid((4,4), (0,3))

ax01 = plt.subplot2grid((4,4), (1,0))
ax11 = plt.subplot2grid((4,4), (1,1))
ax21 = plt.subplot2grid((4,4), (1,2))
ax31 = plt.subplot2grid((4,4), (1,3))

ax02 = plt.subplot2grid((4,4), (2,0))
ax12 = plt.subplot2grid((4,4), (2,1))
ax22 = plt.subplot2grid((4,4), (2,2))
ax32 = plt.subplot2grid((4,4), (2,3))

ax03 = plt.subplot2grid((4,4), (3,0))
ax13 = plt.subplot2grid((4,4), (3,1))
ax23 = plt.subplot2grid((4,4), (3,2))
ax33 = plt.subplot2grid((4,4), (3,3))

############################################
run_plot((total_data), \
         ax00, labels, latent_space, clustering_method)
run_plot(df_log((total_data)), \
         ax10, labels, latent_space, clustering_method)
run_plot(df_total20000((total_data)), \
         ax20, labels, latent_space, clustering_method)
run_plot(df_log(df_total20000((total_data))), \
         ax30, labels, latent_space, clustering_method)
############################################
run_plot(df_minmax(df_cp(total_data)), \
         ax01, labels, latent_space, clustering_method)
run_plot(df_minmax(df_log(df_cp(total_data))), \
         ax11, labels, latent_space, clustering_method)
run_plot(df_minmax(df_total20000(df_cp(total_data))), \
         ax21, labels, latent_space, clustering_method)
run_plot(df_minmax(df_log(df_total20000(df_cp(total_data)))), \
         ax31, labels, latent_space, clustering_method)
############################################
run_plot(df_l2norm(df_cp(total_data)), \
         ax02, labels, latent_space, clustering_method)
run_plot(df_l2norm(df_log(df_cp(total_data))), \
         ax12, labels, latent_space, clustering_method)
run_plot(df_l2norm(df_total20000(df_cp(total_data))), \
         ax22, labels, latent_space, clustering_method)
run_plot(df_l2norm(df_log(df_total20000(df_cp(total_data)))), \
         ax32, labels, latent_space, clustering_method)
############################################
run_plot(df_zscore(df_cp(total_data)), \
         ax03, labels, latent_space, clustering_method)
run_plot(df_zscore(df_log(df_cp(total_data))), \
         ax13, labels, latent_space, clustering_method)
run_plot(df_zscore(df_total20000(df_cp(total_data))), \
         ax23, labels, latent_space, clustering_method)
run_plot(df_zscore(df_log(df_total20000(df_cp(total_data)))), \
         ax33, labels, latent_space, clustering_method)
############################################
ax00.set_ylabel('raw' , fontsize=14)
ax01.set_ylabel('min-max norm' , fontsize=14)
ax02.set_ylabel('l2 norm' , fontsize=14)
ax03.set_ylabel('z-score' , fontsize=14)

ax03.set_xlabel('raw', fontsize=13)
ax13.set_xlabel('log2', fontsize=13)
ax23.set_xlabel('total', fontsize=13)
ax33.set_xlabel('total_log2', fontsize=13)
ax33.legend(bbox_to_anchor=(1.1,0), loc='lower left',borderaxespad=0)
<matplotlib.legend.Legend at 0x7f6c091ce590>
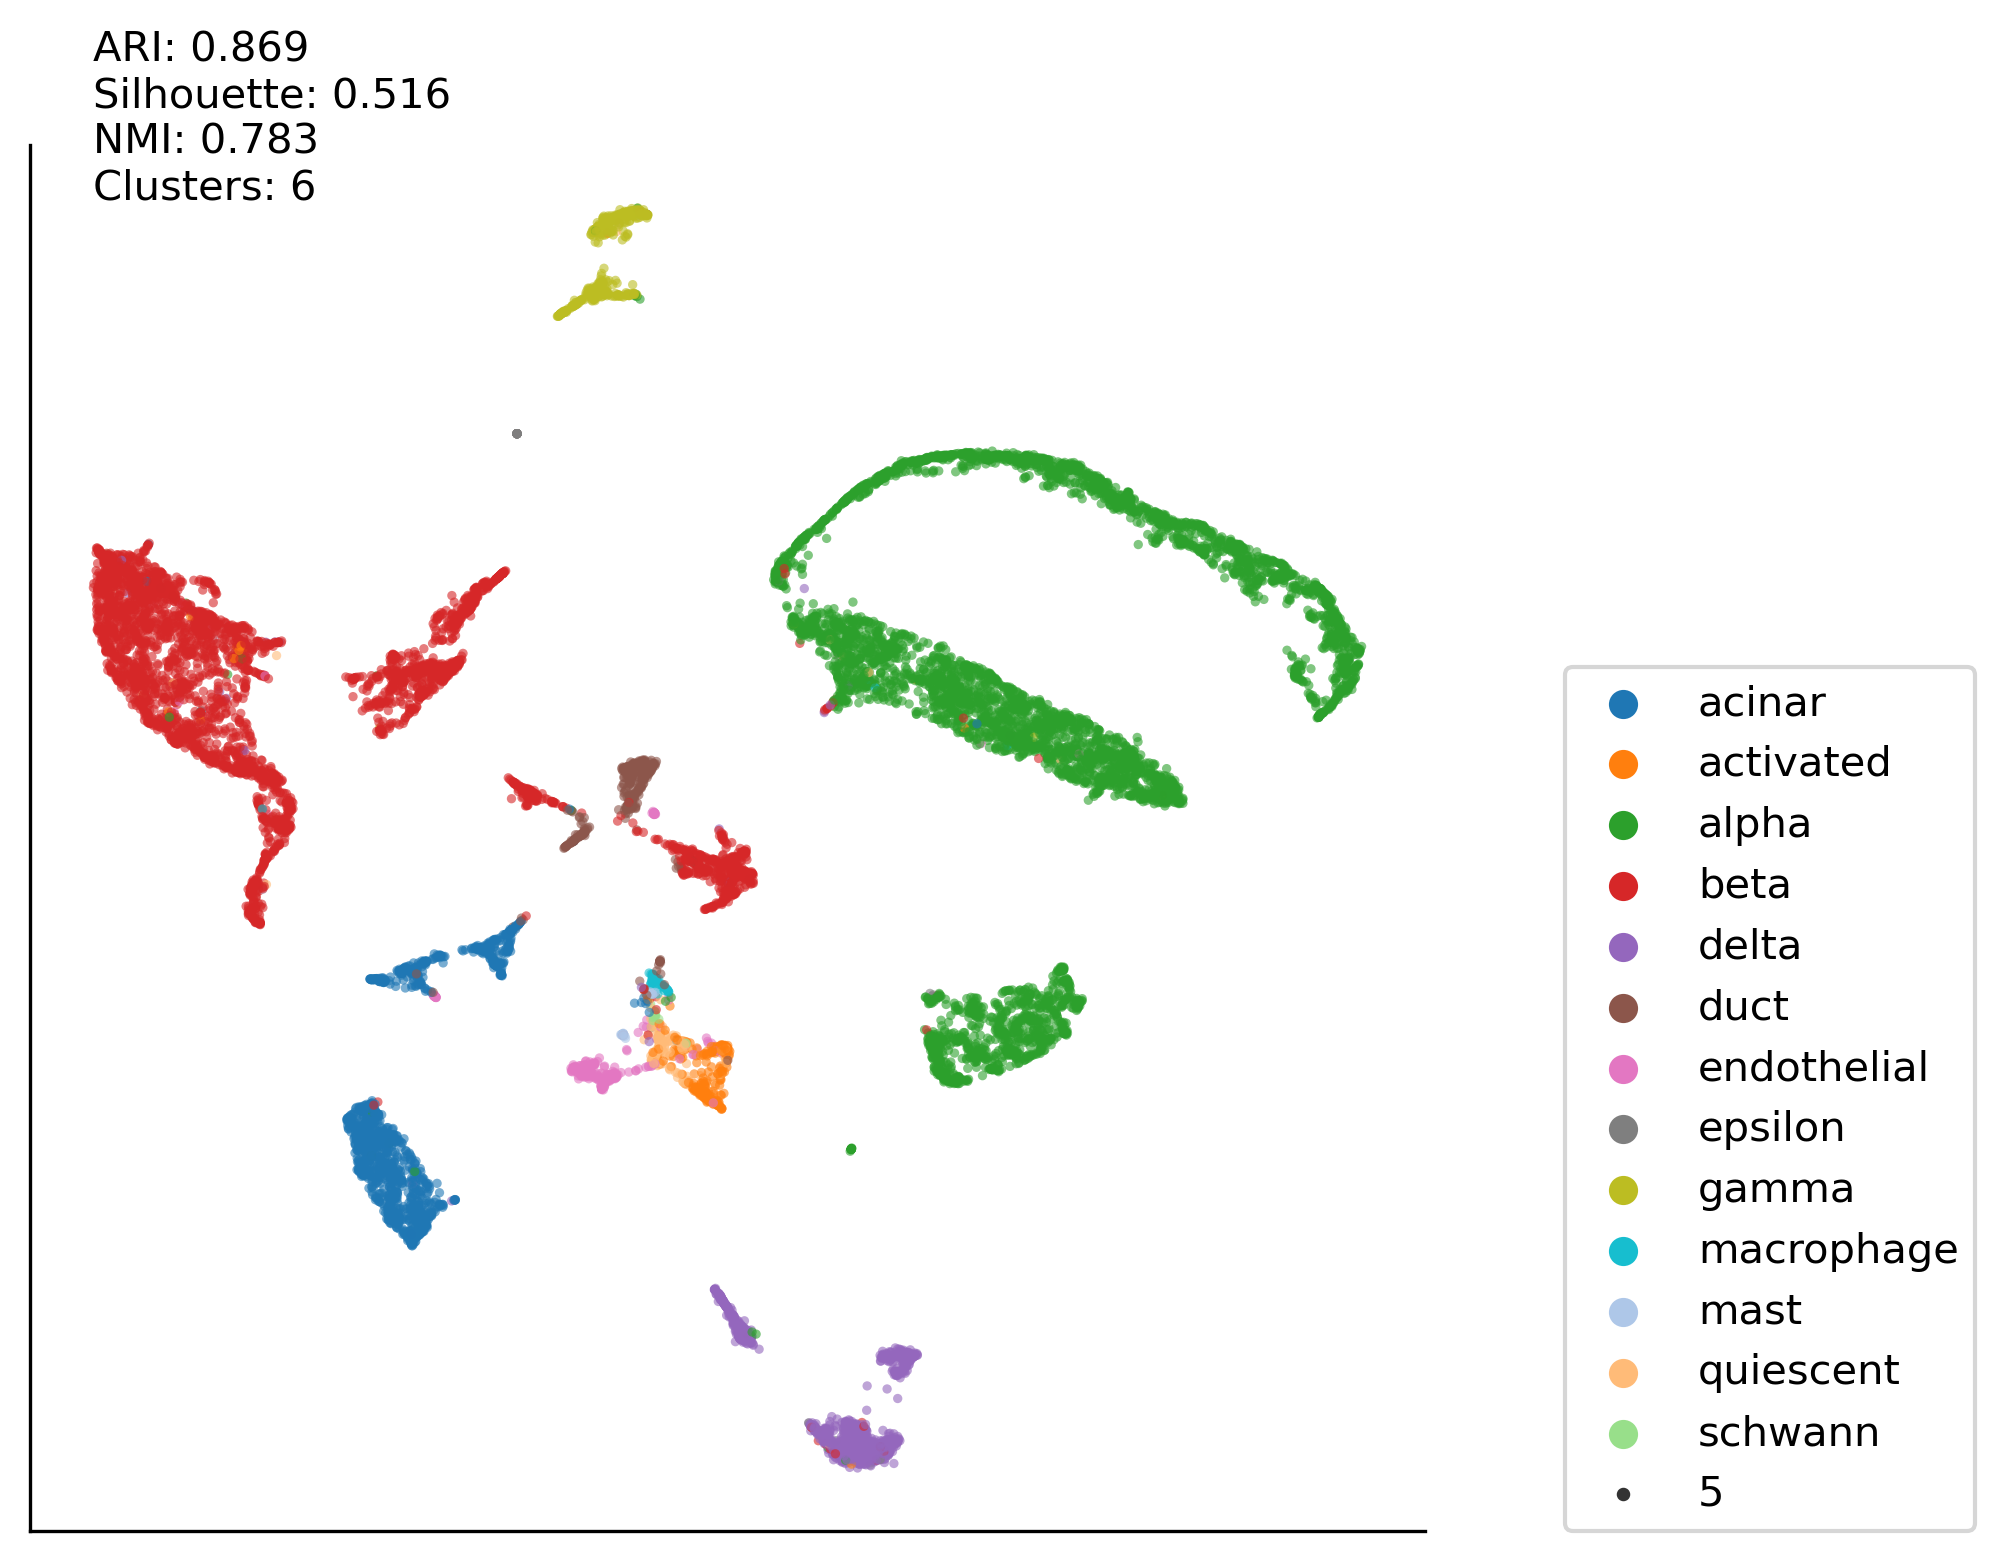
Total:Minmax:PCA50:KMEAN case#
import seaborn as sns
import matplotlib.pyplot as plt
from umap import UMAP
import src.utils as my_u
from src.utils import df_cp
from src.utils import df_minmax
from src.utils import run_plot2


total_data = X_
labels = y_

clustering_method = 'kmean'

plt.figure(figsize=(6,6), dpi=300)
ax00 = plt.subplot2grid((1,1), (0,0))

latent_space = PCA(n_components=50, random_state=0)
latent_space2 = UMAP(n_components=2, init='spectral', random_state=0)
with sns.color_palette(vega_20[::2]+vega_20[1::2]):
    run_plot2(df_minmax((total_data)), \
         ax00, labels, latent_space, latent_space2, clustering_method)
    ax00.legend(bbox_to_anchor=(1.1,0), loc='lower left',borderaxespad=0)
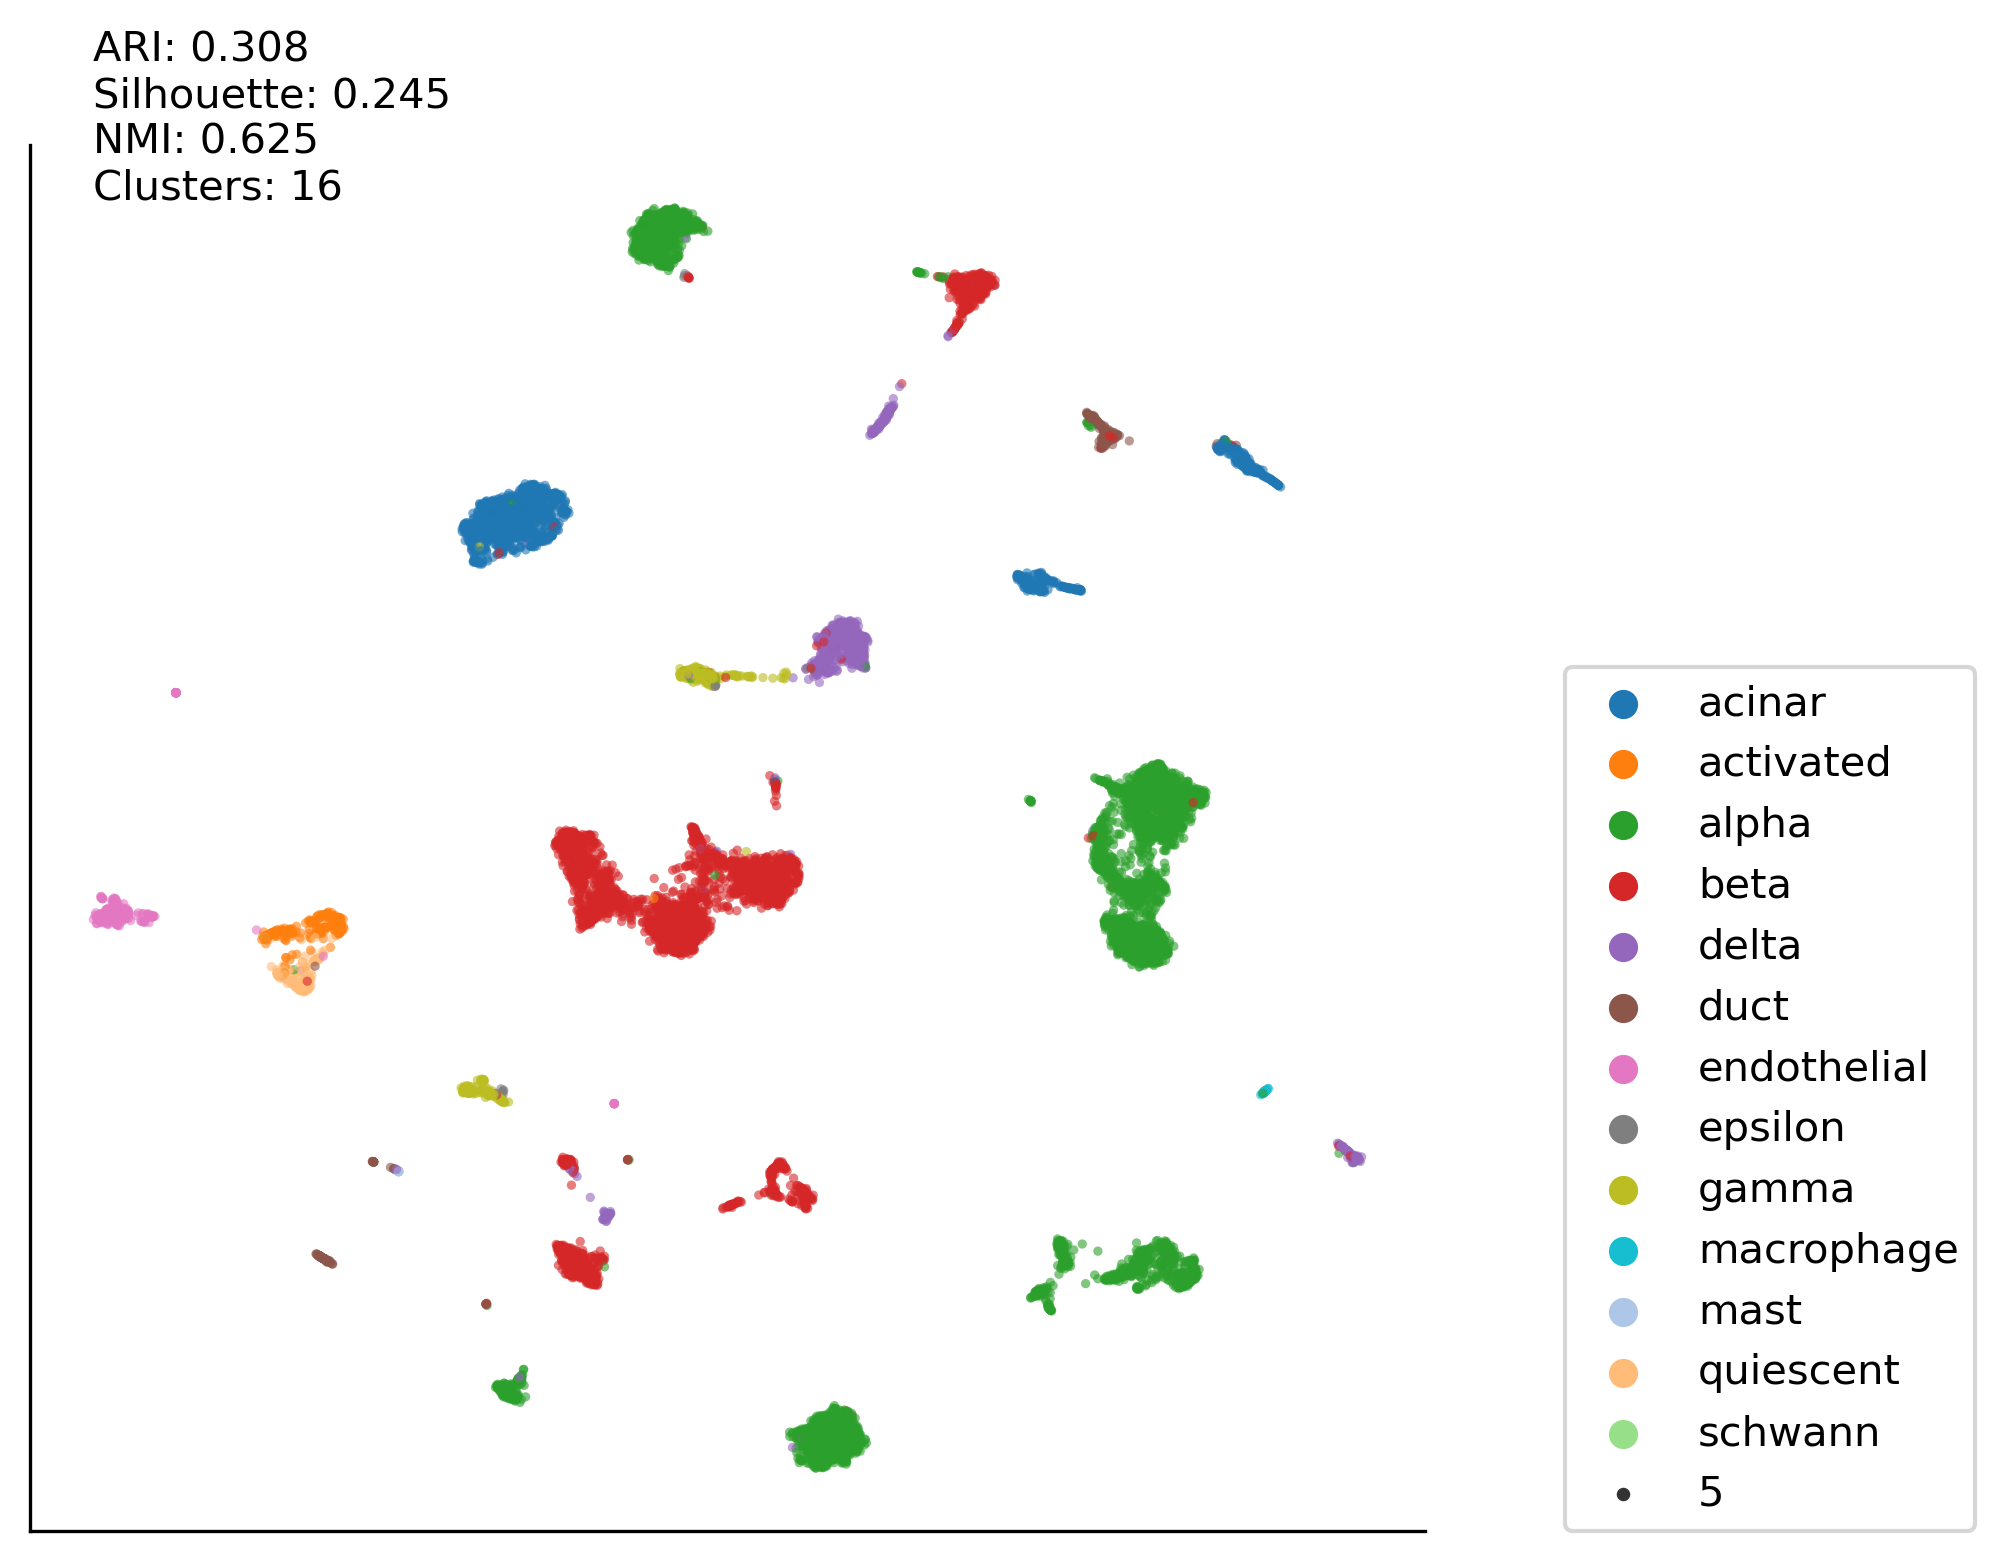
Z-score:PCA50:KMEAN case#
import seaborn as sns
import matplotlib.pyplot as plt
from umap import UMAP
import src.utils as my_u
from src.utils import df_cp
from src.utils import df_minmax
from src.utils import df_log
from src.utils import df_zscore
from src.utils import run_plot2
import pandas as pd

total_data = X_
labels = y_

clustering_method = 'kmean'

plt.figure(figsize=(6,6), dpi=300)
ax00 = plt.subplot2grid((1,1), (0,0))

latent_space = PCA(n_components=50, random_state=0)
latent_space2 = UMAP(n_components=2, init='spectral', random_state=0)
with sns.color_palette(vega_20[::2]+vega_20[1::2]):
    run_plot2(df_zscore(df_cp(pd.DataFrame(adata_hvg.X))), \
         ax00, labels, latent_space, latent_space2, clustering_method)
    ax00.legend(bbox_to_anchor=(1.1,0), loc='lower left',borderaxespad=0)
HP-TSNE:DBSCAN results#
import matplotlib.pyplot as plt
from sklearn.manifold import TSNE

from utils import run_plot
import src.utils as my_u
from src.utils import df_cp
from src.utils import df_log
from src.utils import df_total20000
from src.utils import df_minmax
from src.utils import df_l2norm
from src.utils import df_zscore
from src.utils import df_meansquare
from src.utils import run_plot

total_data = X_
labels = y_

latent_space = TSNE(n_components=2)
clustering_method = 'dbscan'

############################################
plt.figure(figsize=(16,16), dpi=300)
ax00 = plt.subplot2grid((4,4), (0,0))
ax10 = plt.subplot2grid((4,4), (0,1))
ax20 = plt.subplot2grid((4,4), (0,2))
ax30 = plt.subplot2grid((4,4), (0,3))

ax01 = plt.subplot2grid((4,4), (1,0))
ax11 = plt.subplot2grid((4,4), (1,1))
ax21 = plt.subplot2grid((4,4), (1,2))
ax31 = plt.subplot2grid((4,4), (1,3))

ax02 = plt.subplot2grid((4,4), (2,0))
ax12 = plt.subplot2grid((4,4), (2,1))
ax22 = plt.subplot2grid((4,4), (2,2))
ax32 = plt.subplot2grid((4,4), (2,3))

ax03 = plt.subplot2grid((4,4), (3,0))
ax13 = plt.subplot2grid((4,4), (3,1))
ax23 = plt.subplot2grid((4,4), (3,2))
ax33 = plt.subplot2grid((4,4), (3,3))

############################################
run_plot((total_data), \
         ax00, labels, latent_space, clustering_method)
run_plot(df_log((total_data)), \
         ax10, labels, latent_space, clustering_method)
run_plot(df_total20000((total_data)), \
         ax20, labels, latent_space, clustering_method)
run_plot(df_log(df_total20000((total_data))), \
         ax30, labels, latent_space, clustering_method)
############################################
run_plot(df_minmax(df_cp(total_data)), \
         ax01, labels, latent_space, clustering_method)
run_plot(df_minmax(df_log(df_cp(total_data))), \
         ax11, labels, latent_space, clustering_method)
run_plot(df_minmax(df_total20000(df_cp(total_data))), \
         ax21, labels, latent_space, clustering_method)
run_plot(df_minmax(df_log(df_total20000(df_cp(total_data)))), \
         ax31, labels, latent_space, clustering_method)
############################################
run_plot(df_l2norm(df_cp(total_data)), \
         ax02, labels, latent_space, clustering_method)
run_plot(df_l2norm(df_log(df_cp(total_data))), \
         ax12, labels, latent_space, clustering_method)
run_plot(df_l2norm(df_total20000(df_cp(total_data))), \
         ax22, labels, latent_space, clustering_method)
run_plot(df_l2norm(df_log(df_total20000(df_cp(total_data)))), \
         ax32, labels, latent_space, clustering_method)
############################################
run_plot(df_zscore(df_cp(total_data)), \
         ax03, labels, latent_space, clustering_method)
run_plot(df_zscore(df_log(df_cp(total_data))), \
         ax13, labels, latent_space, clustering_method)
run_plot(df_zscore(df_total20000(df_cp(total_data))), \
         ax23, labels, latent_space, clustering_method)
run_plot(df_zscore(df_log(df_total20000(df_cp(total_data)))), \
         ax33, labels, latent_space, clustering_method)
############################################
ax00.set_ylabel('raw' , fontsize=14)
ax01.set_ylabel('min-max norm' , fontsize=14)
ax02.set_ylabel('l2 norm' , fontsize=14)
ax03.set_ylabel('z-score' , fontsize=14)

ax03.set_xlabel('raw', fontsize=13)
ax13.set_xlabel('log2', fontsize=13)
ax23.set_xlabel('total', fontsize=13)
ax33.set_xlabel('total_log2', fontsize=13)
ax33.legend(bbox_to_anchor=(1.1,0), loc='lower left',borderaxespad=0)
<matplotlib.legend.Legend at 0x7f6bd492d2a0>