6-1 Tabular Muris + Baron (Mouse Pancreas)#
import os
import glob
import sys
import pandas as pd
import numpy as np
import random

import matplotlib.pyplot as plt
from sklearn.manifold import TSNE
from umap import UMAP
import seaborn as sns

sys.path.append('../')
import src.utils as my_u
from src.utils import df_cp
from src.utils import df_log
from src.utils import df_total20000
from src.utils import df_minmax
from src.utils import df_l2norm
from src.utils import df_zscore
from src.utils import df_meansquare
from src.utils import run_plot


file_list = glob.glob("../dataset/baron/RAW/*mouse*counts.csv")
print(file_list)
['../dataset/baron/RAW/GSM2230761_mouse1_umifm_counts.csv', '../dataset/baron/RAW/GSM2230762_mouse2_umifm_counts.csv']
total_data = pd.DataFrame()
batch_label = []
for ff in file_list:
    data = pd.read_csv(ff, sep=',', index_col=0, header=0)
    total_data = total_data.append(data)
    batch_label += [ff.split('/')[-1].split('_')[1]] * data.shape[0]
    print(total_data.shape)

labels = total_data['assigned_cluster'].values.tolist()
label_set = set(labels)
print(label_set)
print(set(batch_label))

total_data = total_data.iloc[:,2:]
(822, 14880)
(1886, 14880)
{'schwann', 'gamma', 'T_cell', 'beta', 'endothelial', 'macrophage', 'immune_other', 'quiescent_stellate', 'alpha', 'activated_stellate', 'B_cell', 'delta', 'ductal'}
{'mouse1', 'mouse2'}
baron_labels = labels
baron_blabels = batch_label
baron_total_data = total_data
Tabula Pancreas#
file_list = glob.glob("../data/tabular_muris/00_facs_raw_data/FACS/Pancreas-counts.csv")
sample_per_class = 200

total_data = pd.DataFrame()
for ff in file_list:
    data = pd.read_csv(ff, sep=',', index_col=0, header=0)
    data = data.transpose()
    c = list(range(data.shape[0]))
    total_data = pd.concat([total_data, data.iloc[c,]], axis=0)
    tm_blabels += [x.split('.')[2] for x in data.index]


annot_label = pd.read_csv('../data/tabular_muris/00_facs_raw_data/annotations_FACS.csv', sep=',', index_col=0, header=0)
com = annot_label['tissue'].index.intersection(total_data.index)
m = annot_label.filter(com, axis=0)
#print(m)
total_data = total_data.filter(com, axis=0)
total_data = pd.concat([total_data, m['cell_ontology_class']],axis =1)

tissue = labels
labels = total_data['cell_ontology_class']
labels = labels.values.tolist()

total_data.pop('cell_ontology_class')
total_data.pop('zsGreen_transgene')
tm_blabels = [x.split('.')[2] for x in total_data.index]

print(set(labels))
print(set(tm_blabels))
{'type B pancreatic cell', 'pancreatic ductal cell', 'pancreatic acinar cell', 'leukocyte', 'pancreatic A cell', 'endothelial cell', 'pancreatic PP cell', 'pancreatic D cell', 'pancreatic stellate cell'}
{'3_8_M', '3_10_M', '3_39_F', '3_38_F'}
tabula_data = total_data
tabula_labels = labels
tabula_blabels = tm_blabels
Integrate two dataset#
common_gene = baron_total_data.columns.intersection(tabula_data.columns)
common_gene
Index(['0610007P14Rik', '0610009B22Rik', '0610009L18Rik', '0610009O20Rik',
       '0610010F05Rik', '0610010K14Rik', '0610011F06Rik', '0610012G03Rik',
       '0610030E20Rik', '0610037L13Rik',
       ...
       'Zw10', 'Zwilch', 'Zwint', 'Zxdb', 'Zxdc', 'Zyg11b', 'Zyx', 'Zzef1',
       'Zzz3', 'l7Rn6'],
      dtype='object', length=13263)
tabula_data = tabula_data.filter(common_gene)
baron_total_data = baron_total_data.filter(common_gene)
total_data = pd.concat([tabula_data,baron_total_data], axis=0)
labels =  tabula_labels + baron_labels
blabels = tabula_blabels + baron_blabels
print(total_data.shape)
print(set(labels))
print(len(blabels),set(blabels))
(3213, 13263)
{'type B pancreatic cell', 'endothelial', 'pancreatic A cell', 'endothelial cell', 'pancreatic D cell', 'B_cell', 'ductal', 'pancreatic ductal cell', 'beta', 'schwann', 'leukocyte', 'macrophage', 'pancreatic PP cell', 'immune_other', 'quiescent_stellate', 'delta', 'gamma', 'T_cell', 'pancreatic acinar cell', 'alpha', 'activated_stellate', 'pancreatic stellate cell'}
3213 {'3_8_M', '3_10_M', '3_38_F', 'mouse1', '3_39_F', 'mouse2'}
Label integration#
new_lab = []
for x in labels:
    try:
        x=x.replace('pancreatic A cell', 'alpha')
    except:
        pass
    try:
        x=x.replace('endothelial cell', 'endothelial')
    except:
        pass
    try:
        x=x.replace('pancreatic D cell', 'delta')
    except:
        pass
    try:
        x=x.replace('pancreatic acinar cell', 'acinar')
    except:
        pass
    try:
        x=x.replace('pancreatic ductal cell', 'ductal')
    except:
        pass
    try:
        x=x.replace('type B pancreatic cell', 'beta')
    except:
        pass
    try:
        x=x.replace('pancreatic stellate cell', 'stellate')
    except:
        pass
    try:
        x=x.replace('activated_stellate', 'stellate')
    except:
        pass
    try:
        x=x.replace('quiescent_stellate', 'stellate')
    except:
        pass
    new_lab.append(x)
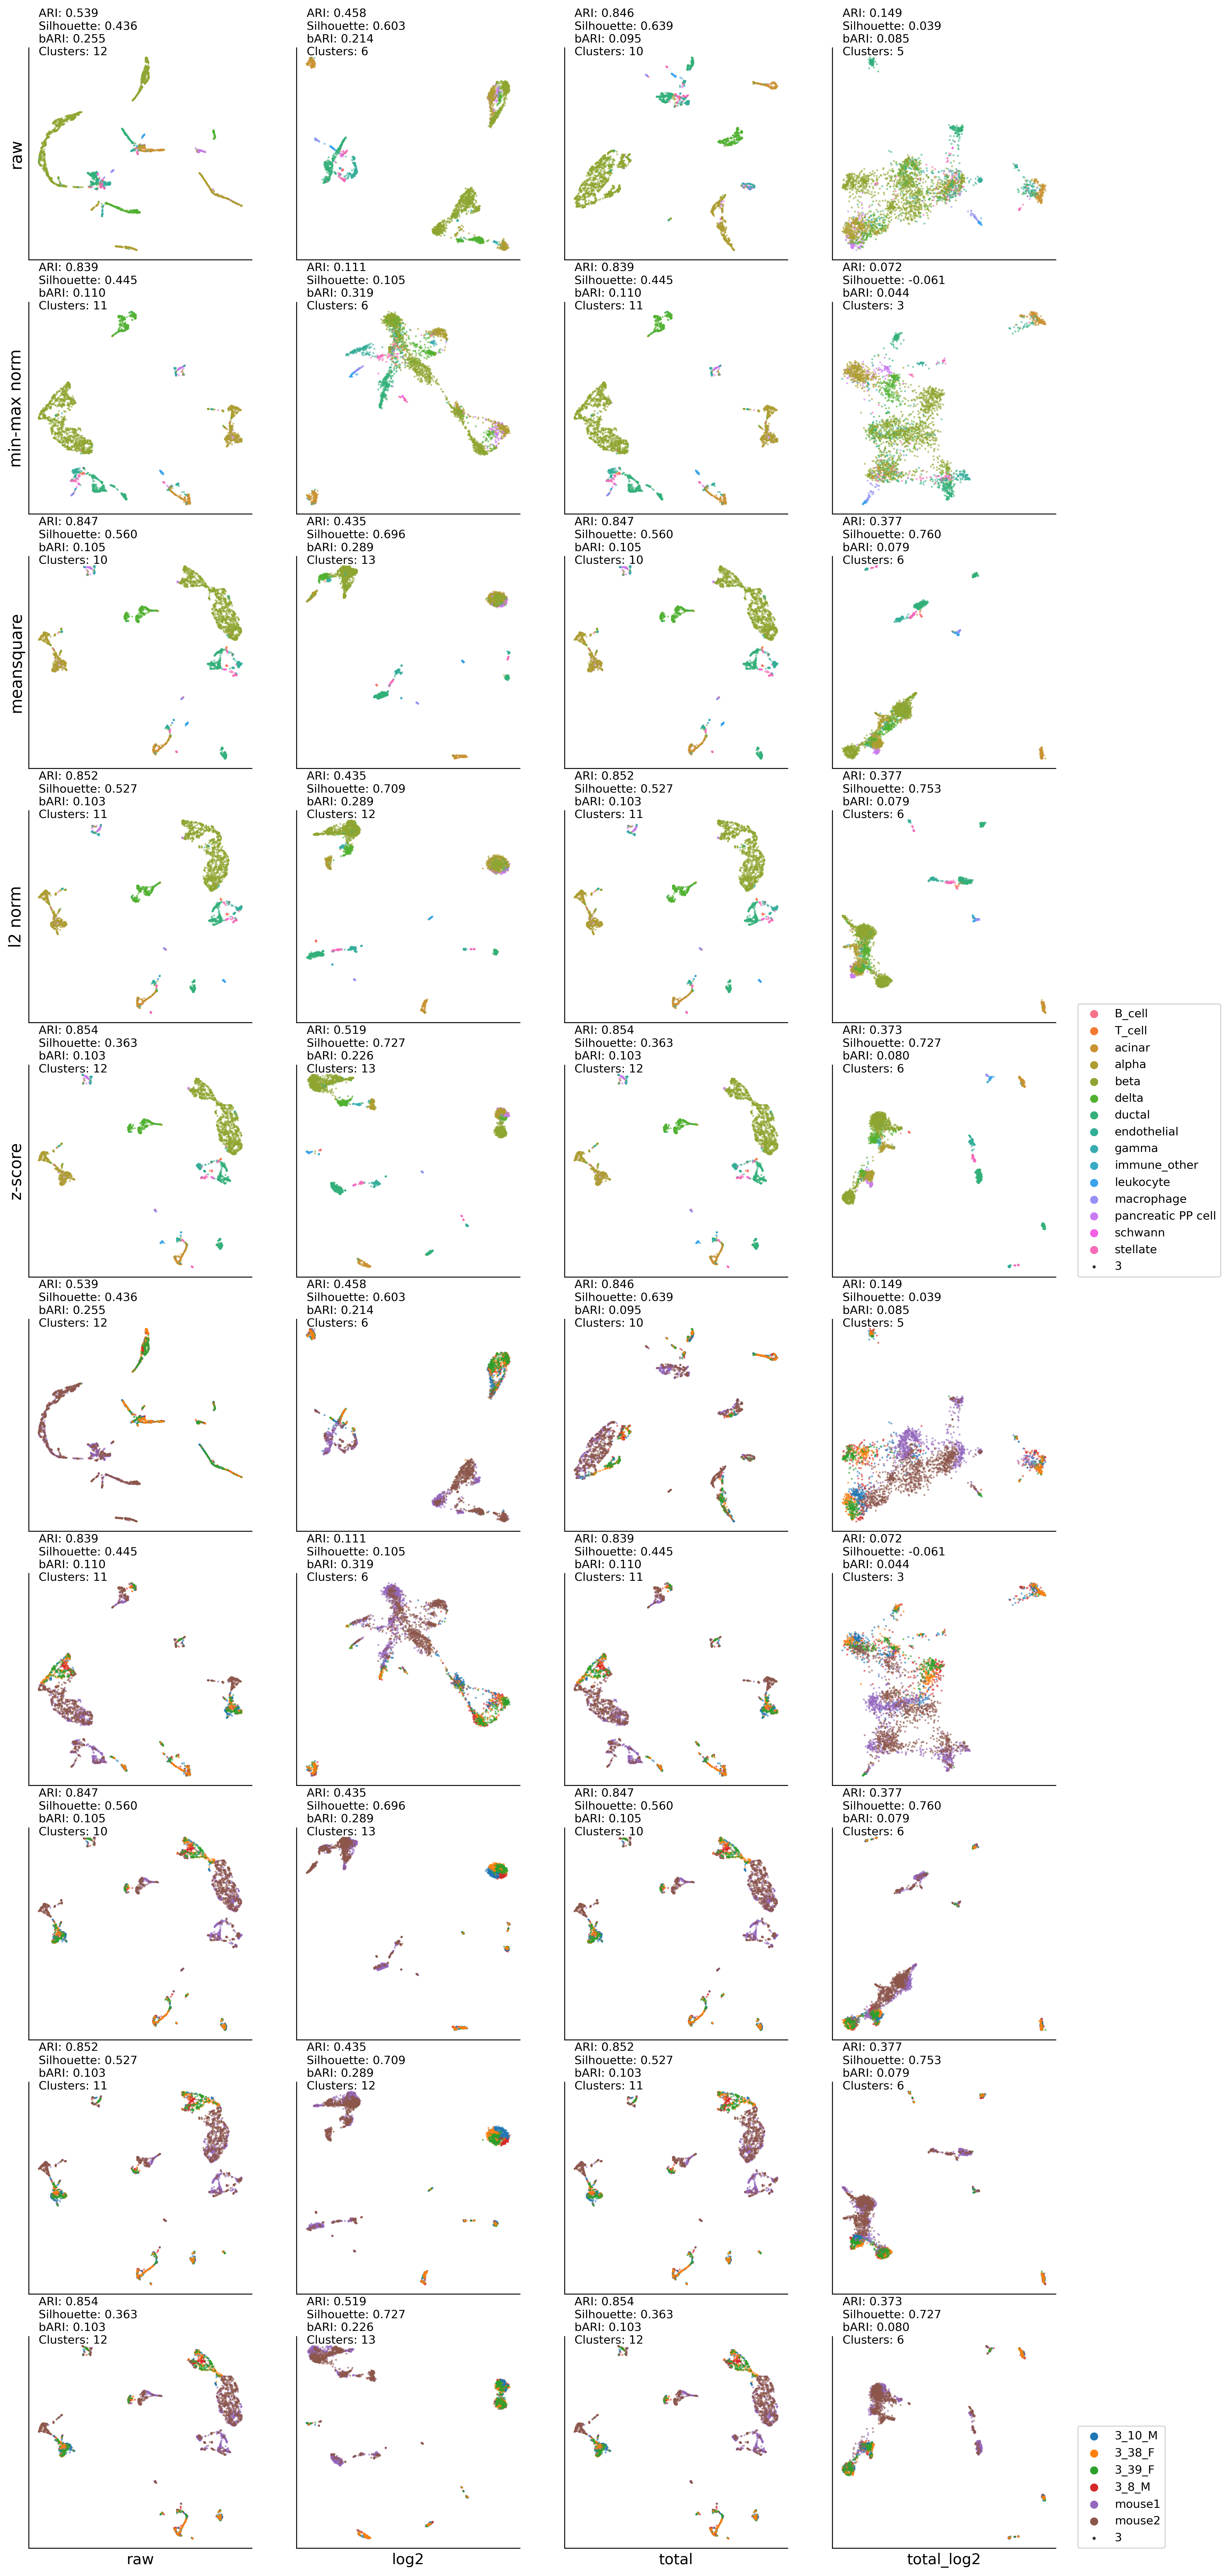
UMAP:DBSCAN results#
clustering_method = 'dbscan'

############################################
plt.figure(figsize=(16,40), dpi=300)
ax00 = plt.subplot2grid((10,4), (0,0))
ax10 = plt.subplot2grid((10,4), (0,1))
ax20 = plt.subplot2grid((10,4), (0,2))
ax30 = plt.subplot2grid((10,4), (0,3))

ax01 = plt.subplot2grid((10,4), (1,0))
ax11 = plt.subplot2grid((10,4), (1,1))
ax21 = plt.subplot2grid((10,4), (1,2))
ax31 = plt.subplot2grid((10,4), (1,3))

ax02 = plt.subplot2grid((10,4), (2,0))
ax12 = plt.subplot2grid((10,4), (2,1))
ax22 = plt.subplot2grid((10,4), (2,2))
ax32 = plt.subplot2grid((10,4), (2,3))

ax03 = plt.subplot2grid((10,4), (3,0))
ax13 = plt.subplot2grid((10,4), (3,1))
ax23 = plt.subplot2grid((10,4), (3,2))
ax33 = plt.subplot2grid((10,4), (3,3))

ax04 = plt.subplot2grid((10,4), (4,0))
ax14 = plt.subplot2grid((10,4), (4,1))
ax24 = plt.subplot2grid((10,4), (4,2))
ax34 = plt.subplot2grid((10,4), (4,3))

ax05 = plt.subplot2grid((10,4), (5,0))
ax15 = plt.subplot2grid((10,4), (5,1))
ax25 = plt.subplot2grid((10,4), (5,2))
ax35 = plt.subplot2grid((10,4), (5,3))

ax06 = plt.subplot2grid((10,4), (6,0))
ax16 = plt.subplot2grid((10,4), (6,1))
ax26 = plt.subplot2grid((10,4), (6,2))
ax36 = plt.subplot2grid((10,4), (6,3))

ax07 = plt.subplot2grid((10,4), (7,0))
ax17 = plt.subplot2grid((10,4), (7,1))
ax27 = plt.subplot2grid((10,4), (7,2))
ax37 = plt.subplot2grid((10,4), (7,3))

ax08 = plt.subplot2grid((10,4), (8,0))
ax18 = plt.subplot2grid((10,4), (8,1))
ax28 = plt.subplot2grid((10,4), (8,2))
ax38 = plt.subplot2grid((10,4), (8,3))

ax09 = plt.subplot2grid((10,4), (9,0))
ax19 = plt.subplot2grid((10,4), (9,1))
ax29 = plt.subplot2grid((10,4), (9,2))
ax39 = plt.subplot2grid((10,4), (9,3))

l = []
############################################
latent_space = UMAP(n_components=2, init='spectral', random_state=0)
l.append(run_plot(df_cp(total_data), \
         ax00, new_lab, latent_space, clustering_method, blabels=blabels, b_ax=ax05)
        )
latent_space = UMAP(n_components=2, init='spectral', random_state=0)
l.append(run_plot(df_log(df_cp(total_data)), \
         ax10, new_lab, latent_space, clustering_method, blabels=blabels, b_ax=ax15)
        )
latent_space = UMAP(n_components=2, init='spectral', random_state=0)
l.append(run_plot(df_total20000(df_cp(total_data)), \
         ax20, new_lab, latent_space, clustering_method, blabels=blabels, b_ax=ax25)
        )
latent_space = UMAP(n_components=2, init='spectral', random_state=0)
l.append(run_plot(df_log(df_total20000(df_cp(total_data))), \
         ax30, new_lab, latent_space, clustering_method, blabels=blabels, b_ax=ax35)
        )
############################################
latent_space = UMAP(n_components=2, init='spectral', random_state=0)
l.append(run_plot(df_minmax(df_cp(total_data)), \
         ax01, new_lab, latent_space, clustering_method, blabels=blabels, b_ax=ax06)
        )
latent_space = UMAP(n_components=2, init='spectral', random_state=0)
l.append(run_plot(df_minmax(df_log(df_cp(total_data))), \
         ax11, new_lab, latent_space, clustering_method, blabels=blabels, b_ax=ax16)
        )
latent_space = UMAP(n_components=2, init='spectral', random_state=0)
l.append(run_plot(df_minmax(df_total20000(df_cp(total_data))), \
         ax21, new_lab, latent_space, clustering_method, blabels=blabels, b_ax=ax26)
        )
latent_space = UMAP(n_components=2, init='spectral', random_state=0)
l.append(run_plot(df_minmax(df_log(df_total20000(df_cp(total_data)))), \
         ax31, new_lab, latent_space, clustering_method, blabels=blabels, b_ax=ax36)
        )
############################################
latent_space = UMAP(n_components=2, init='spectral', random_state=0)
l.append(run_plot(df_meansquare(df_cp(total_data)), \
         ax02, new_lab, latent_space, clustering_method, blabels=blabels, b_ax=ax07)
        )
latent_space = UMAP(n_components=2, init='spectral', random_state=0)
l.append(run_plot(df_meansquare(df_log(df_cp(total_data))), \
         ax12, new_lab, latent_space, clustering_method, blabels=blabels, b_ax=ax17)
        )
latent_space = UMAP(n_components=2, init='spectral', random_state=0)
l.append(run_plot(df_meansquare(df_total20000(df_cp(total_data))), \
         ax22, new_lab, latent_space, clustering_method, blabels=blabels, b_ax=ax27)
        )
latent_space = UMAP(n_components=2, init='spectral', random_state=0)
l.append(run_plot(df_meansquare(df_log(df_total20000(df_cp(total_data)))), \
         ax32, new_lab, latent_space, clustering_method, blabels=blabels, b_ax=ax37)
        )
############################################
latent_space = UMAP(n_components=2, init='spectral', random_state=0)
l.append(run_plot(df_l2norm(df_cp(total_data)), \
         ax03, new_lab, latent_space, clustering_method, blabels=blabels, b_ax=ax08)
        )
latent_space = UMAP(n_components=2, init='spectral', random_state=0)
l.append(run_plot(df_l2norm(df_log(df_cp(total_data))), \
         ax13, new_lab, latent_space, clustering_method, blabels=blabels, b_ax=ax18)
        )
latent_space = UMAP(n_components=2, init='spectral', random_state=0)
l.append(run_plot(df_l2norm(df_total20000(df_cp(total_data))), \
         ax23, new_lab, latent_space, clustering_method, blabels=blabels, b_ax=ax28)
        )
latent_space = UMAP(n_components=2, init='spectral', random_state=0)
l.append(run_plot(df_l2norm(df_log(df_total20000(df_cp(total_data)))), \
         ax33, new_lab, latent_space, clustering_method, blabels=blabels, b_ax=ax38)
        )
############################################
latent_space = UMAP(n_components=2, init='spectral', random_state=0)
l.append(run_plot(df_zscore(df_cp(total_data)), \
         ax04, new_lab, latent_space, clustering_method, blabels=blabels, b_ax=ax09)
        )
latent_space = UMAP(n_components=2, init='spectral', random_state=0)
l.append(run_plot(df_zscore(df_log(df_cp(total_data))), \
         ax14, new_lab, latent_space, clustering_method, blabels=blabels, b_ax=ax19)
        )
latent_space = UMAP(n_components=2, init='spectral', random_state=0)
l.append(run_plot(df_zscore(df_total20000(df_cp(total_data))), \
         ax24, new_lab, latent_space, clustering_method, blabels=blabels, b_ax=ax29)
        )
latent_space = UMAP(n_components=2, init='spectral', random_state=0)
l.append(run_plot(df_zscore(df_log(df_total20000(df_cp(total_data)))), \
         ax34, new_lab, latent_space, clustering_method, blabels=blabels, b_ax=ax39)
        )
############################################
ax00.set_ylabel('raw' , fontsize=14)
ax01.set_ylabel('min-max norm' , fontsize=14)
ax02.set_ylabel('meansquare' , fontsize=14)
ax03.set_ylabel('l2 norm' , fontsize=14)
ax04.set_ylabel('z-score' , fontsize=14)

ax09.set_xlabel('raw', fontsize=13)
ax19.set_xlabel('log2', fontsize=13)
ax29.set_xlabel('total', fontsize=13)
ax39.set_xlabel('total_log2', fontsize=13)
ax34.legend(bbox_to_anchor=(1.1,0), loc='lower left',borderaxespad=0)
ax39.legend(bbox_to_anchor=(1.1,0), loc='lower left',borderaxespad=0)
dbscan #cluster: (12, 0.5393738244143649, 0.4359436, 0.254511768019079)
dbscan #cluster: (6, 0.45845976386795656, 0.6027394, 0.21367291037178343)
dbscan #cluster: (10, 0.8456817966684527, 0.6389148, 0.09504719747717269)
dbscan #cluster: (5, 0.14896754086843214, 0.039181933, 0.08546582045939978)
dbscan #cluster: (11, 0.8393241175946992, 0.44507247, 0.11018758606691727)
dbscan #cluster: (6, 0.11052629859835017, 0.10489131, 0.3188126205267489)
dbscan #cluster: (11, 0.8393241175946992, 0.44507247, 0.11018758606691727)
dbscan #cluster: (3, 0.07195708535505654, -0.060698707, 0.04448420667590741)
dbscan #cluster: (10, 0.8468864003531509, 0.56038797, 0.10515687396759911)
dbscan #cluster: (13, 0.4348282760736753, 0.69593513, 0.28919248846419493)
dbscan #cluster: (10, 0.8468864003531509, 0.56038797, 0.10515687396759911)
dbscan #cluster: (6, 0.37748005105763005, 0.7595276, 0.07911572492030552)
dbscan #cluster: (11, 0.8522993025135447, 0.5266641, 0.10346501668065812)
dbscan #cluster: (12, 0.4352494651606304, 0.7085677, 0.28949947502261336)
dbscan #cluster: (11, 0.8522993025135447, 0.5266641, 0.10346501668065812)
dbscan #cluster: (6, 0.37685733580104736, 0.753428, 0.07939033200720802)
dbscan #cluster: (12, 0.8536164969950153, 0.36330906, 0.10299999941354561)
dbscan #cluster: (13, 0.5193467171551647, 0.72709787, 0.22605628102850836)
dbscan #cluster: (12, 0.8536164969950153, 0.36330906, 0.10299999941354561)
dbscan #cluster: (6, 0.3732698480371928, 0.72716504, 0.0803068485443782)
<matplotlib.legend.Legend at 0x7f55e5da0790>

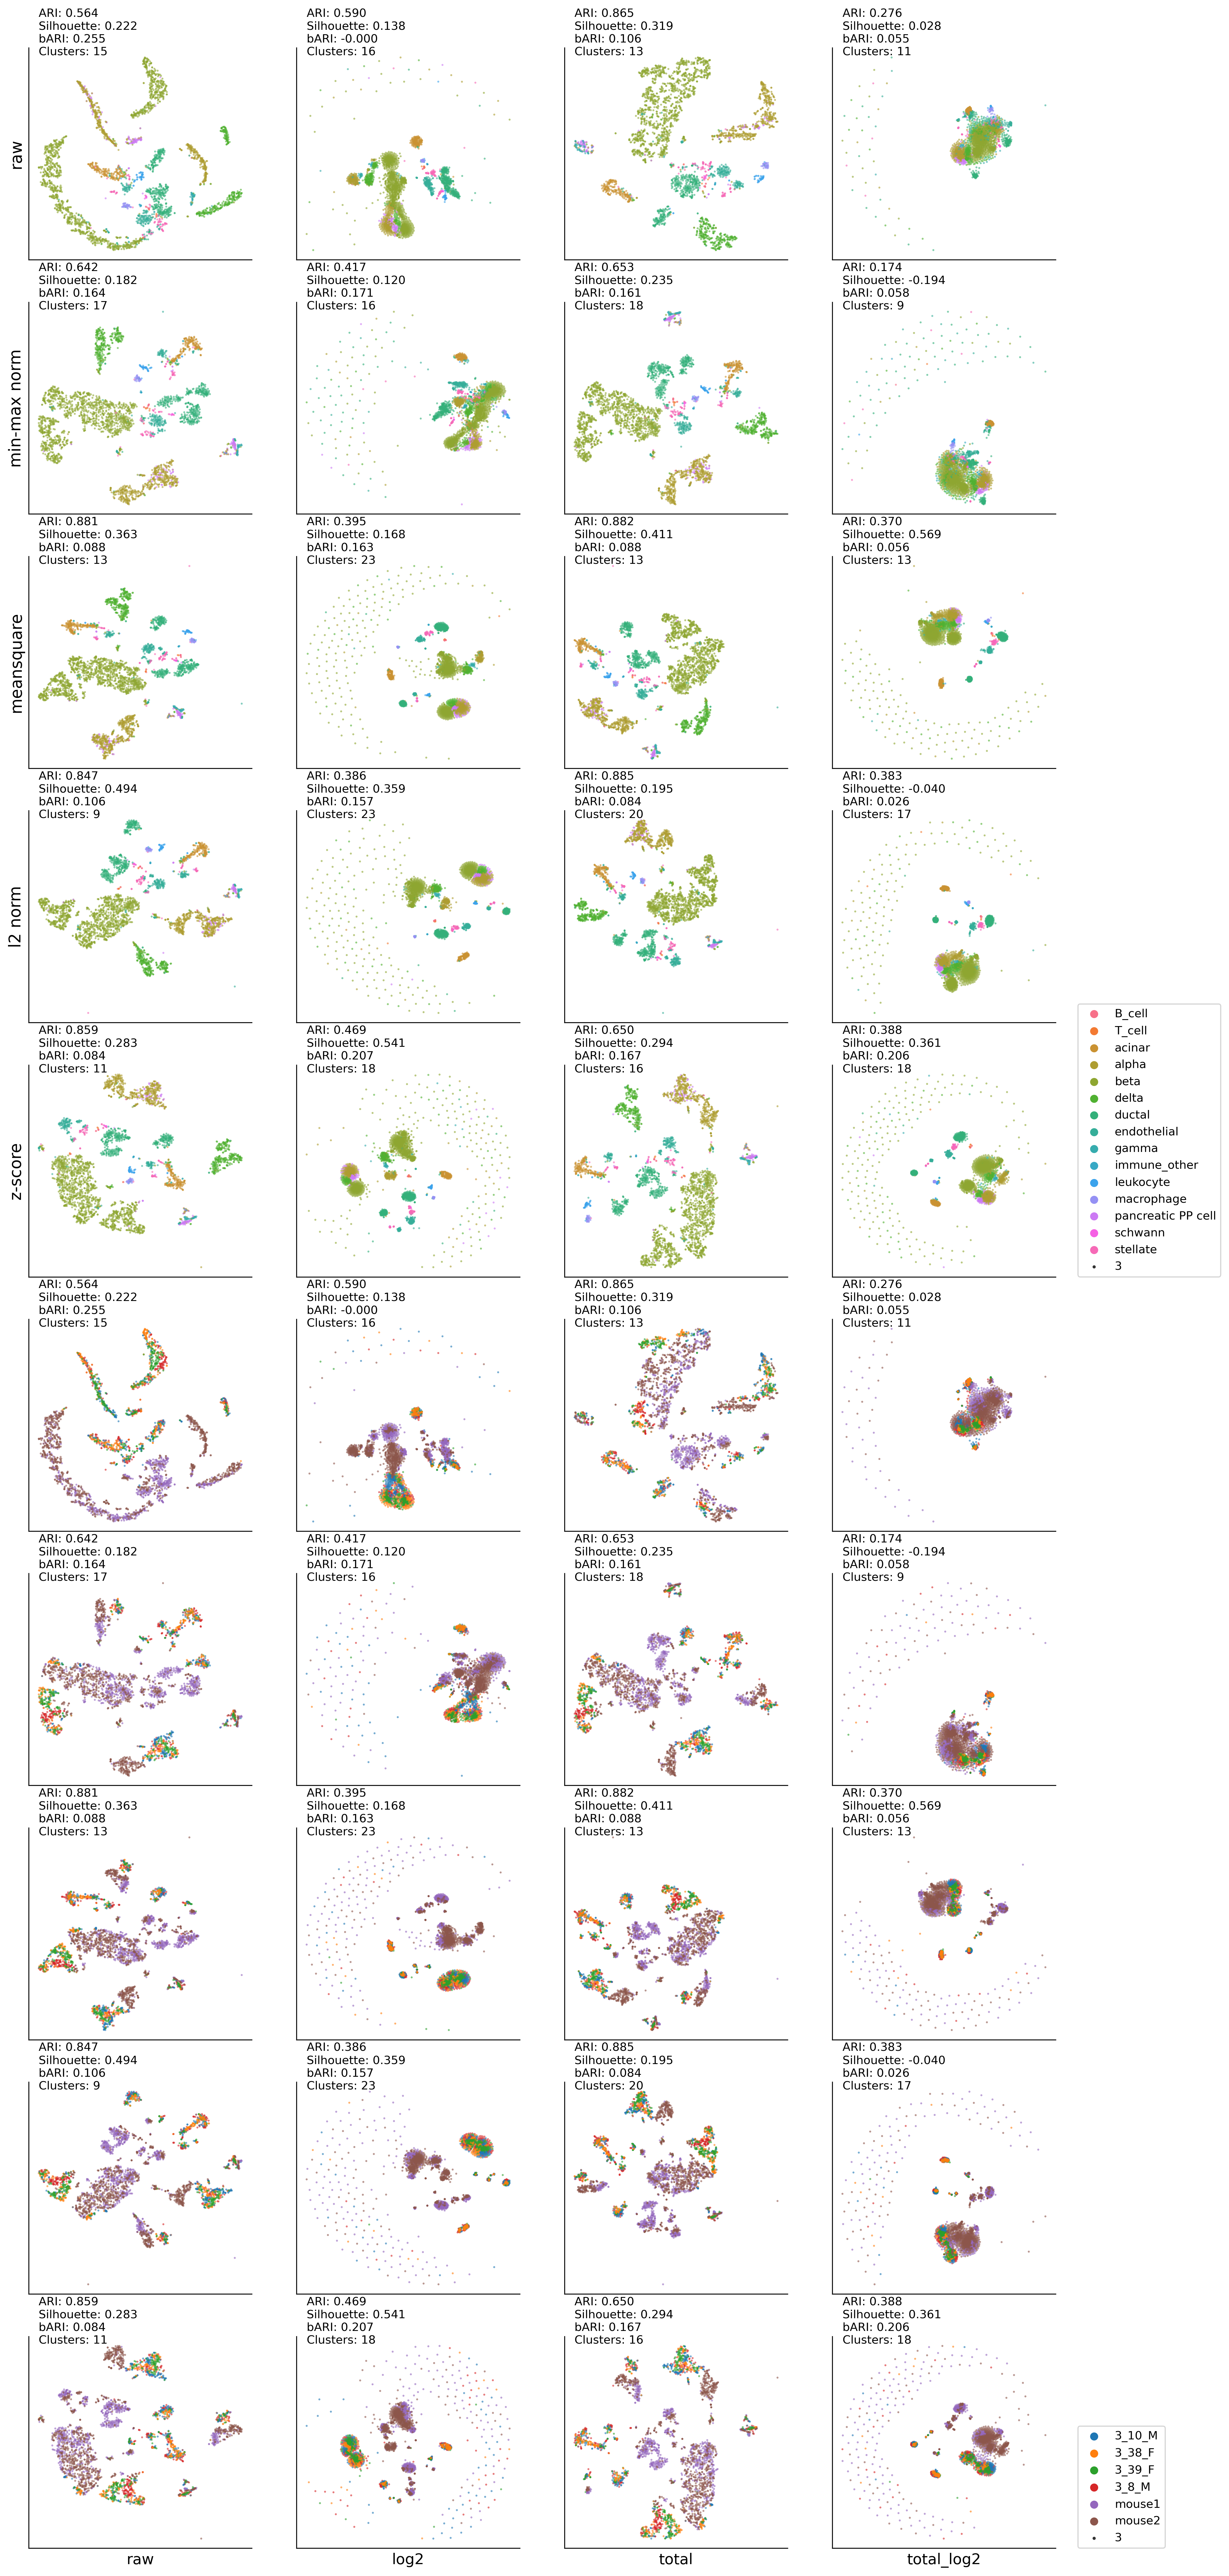
t-SNE:DBSCAN results#
clustering_method = 'dbscan'

############################################
plt.figure(figsize=(16,40), dpi=300)
ax00 = plt.subplot2grid((10,4), (0,0))
ax10 = plt.subplot2grid((10,4), (0,1))
ax20 = plt.subplot2grid((10,4), (0,2))
ax30 = plt.subplot2grid((10,4), (0,3))

ax01 = plt.subplot2grid((10,4), (1,0))
ax11 = plt.subplot2grid((10,4), (1,1))
ax21 = plt.subplot2grid((10,4), (1,2))
ax31 = plt.subplot2grid((10,4), (1,3))

ax02 = plt.subplot2grid((10,4), (2,0))
ax12 = plt.subplot2grid((10,4), (2,1))
ax22 = plt.subplot2grid((10,4), (2,2))
ax32 = plt.subplot2grid((10,4), (2,3))

ax03 = plt.subplot2grid((10,4), (3,0))
ax13 = plt.subplot2grid((10,4), (3,1))
ax23 = plt.subplot2grid((10,4), (3,2))
ax33 = plt.subplot2grid((10,4), (3,3))

ax04 = plt.subplot2grid((10,4), (4,0))
ax14 = plt.subplot2grid((10,4), (4,1))
ax24 = plt.subplot2grid((10,4), (4,2))
ax34 = plt.subplot2grid((10,4), (4,3))

ax05 = plt.subplot2grid((10,4), (5,0))
ax15 = plt.subplot2grid((10,4), (5,1))
ax25 = plt.subplot2grid((10,4), (5,2))
ax35 = plt.subplot2grid((10,4), (5,3))

ax06 = plt.subplot2grid((10,4), (6,0))
ax16 = plt.subplot2grid((10,4), (6,1))
ax26 = plt.subplot2grid((10,4), (6,2))
ax36 = plt.subplot2grid((10,4), (6,3))

ax07 = plt.subplot2grid((10,4), (7,0))
ax17 = plt.subplot2grid((10,4), (7,1))
ax27 = plt.subplot2grid((10,4), (7,2))
ax37 = plt.subplot2grid((10,4), (7,3))

ax08 = plt.subplot2grid((10,4), (8,0))
ax18 = plt.subplot2grid((10,4), (8,1))
ax28 = plt.subplot2grid((10,4), (8,2))
ax38 = plt.subplot2grid((10,4), (8,3))

ax09 = plt.subplot2grid((10,4), (9,0))
ax19 = plt.subplot2grid((10,4), (9,1))
ax29 = plt.subplot2grid((10,4), (9,2))
ax39 = plt.subplot2grid((10,4), (9,3))

l = []
############################################
latent_space = TSNE(n_components=2)
l.append(run_plot(df_cp(total_data), \
         ax00, new_lab, latent_space, clustering_method, blabels=blabels, b_ax=ax05)
        )
latent_space = TSNE(n_components=2)
l.append(run_plot(df_log(df_cp(total_data)), \
         ax10, new_lab, latent_space, clustering_method, blabels=blabels, b_ax=ax15)
        )
latent_space = TSNE(n_components=2)
l.append(run_plot(df_total20000(df_cp(total_data)), \
         ax20, new_lab, latent_space, clustering_method, blabels=blabels, b_ax=ax25)
        )
latent_space = TSNE(n_components=2)
l.append(run_plot(df_log(df_total20000(df_cp(total_data))), \
         ax30, new_lab, latent_space, clustering_method, blabels=blabels, b_ax=ax35)
        )
############################################
latent_space = TSNE(n_components=2)
l.append(run_plot(df_minmax(df_cp(total_data)), \
         ax01, new_lab, latent_space, clustering_method, blabels=blabels, b_ax=ax06)
        )
latent_space = TSNE(n_components=2)
l.append(run_plot(df_minmax(df_log(df_cp(total_data))), \
         ax11, new_lab, latent_space, clustering_method, blabels=blabels, b_ax=ax16)
        )
latent_space = TSNE(n_components=2)
l.append(run_plot(df_minmax(df_total20000(df_cp(total_data))), \
         ax21, new_lab, latent_space, clustering_method, blabels=blabels, b_ax=ax26)
        )
latent_space = TSNE(n_components=2)
l.append(run_plot(df_minmax(df_log(df_total20000(df_cp(total_data)))), \
         ax31, new_lab, latent_space, clustering_method, blabels=blabels, b_ax=ax36)
        )
############################################
latent_space = TSNE(n_components=2)
l.append(run_plot(df_meansquare(df_cp(total_data)), \
         ax02, new_lab, latent_space, clustering_method, blabels=blabels, b_ax=ax07)
        )
latent_space = TSNE(n_components=2)
l.append(run_plot(df_meansquare(df_log(df_cp(total_data))), \
         ax12, new_lab, latent_space, clustering_method, blabels=blabels, b_ax=ax17)
        )
latent_space = TSNE(n_components=2)
l.append(run_plot(df_meansquare(df_total20000(df_cp(total_data))), \
         ax22, new_lab, latent_space, clustering_method, blabels=blabels, b_ax=ax27)
        )
latent_space = TSNE(n_components=2)
l.append(run_plot(df_meansquare(df_log(df_total20000(df_cp(total_data)))), \
         ax32, new_lab, latent_space, clustering_method, blabels=blabels, b_ax=ax37)
        )
############################################
latent_space = TSNE(n_components=2)
l.append(run_plot(df_l2norm(df_cp(total_data)), \
         ax03, new_lab, latent_space, clustering_method, blabels=blabels, b_ax=ax08)
        )
latent_space = TSNE(n_components=2)
l.append(run_plot(df_l2norm(df_log(df_cp(total_data))), \
         ax13, new_lab, latent_space, clustering_method, blabels=blabels, b_ax=ax18)
        )
latent_space = TSNE(n_components=2)
l.append(run_plot(df_l2norm(df_total20000(df_cp(total_data))), \
         ax23, new_lab, latent_space, clustering_method, blabels=blabels, b_ax=ax28)
        )
latent_space = TSNE(n_components=2)
l.append(run_plot(df_l2norm(df_log(df_total20000(df_cp(total_data)))), \
         ax33, new_lab, latent_space, clustering_method, blabels=blabels, b_ax=ax38)
        )
############################################
latent_space = TSNE(n_components=2)
l.append(run_plot(df_zscore(df_cp(total_data)), \
         ax04, new_lab, latent_space, clustering_method, blabels=blabels, b_ax=ax09)
        )
latent_space = TSNE(n_components=2)
l.append(run_plot(df_zscore(df_log(df_cp(total_data))), \
         ax14, new_lab, latent_space, clustering_method, blabels=blabels, b_ax=ax19)
        )
latent_space = TSNE(n_components=2)
l.append(run_plot(df_zscore(df_total20000(df_cp(total_data))), \
         ax24, new_lab, latent_space, clustering_method, blabels=blabels, b_ax=ax29)
        )
latent_space = TSNE(n_components=2)
l.append(run_plot(df_zscore(df_log(df_total20000(df_cp(total_data)))), \
         ax34, new_lab, latent_space, clustering_method, blabels=blabels, b_ax=ax39)
        )
############################################
ax00.set_ylabel('raw' , fontsize=14)
ax01.set_ylabel('min-max norm' , fontsize=14)
ax02.set_ylabel('meansquare' , fontsize=14)
ax03.set_ylabel('l2 norm' , fontsize=14)
ax04.set_ylabel('z-score' , fontsize=14)

ax09.set_xlabel('raw', fontsize=13)
ax19.set_xlabel('log2', fontsize=13)
ax29.set_xlabel('total', fontsize=13)
ax39.set_xlabel('total_log2', fontsize=13)
ax34.legend(bbox_to_anchor=(1.1,0), loc='lower left',borderaxespad=0)
ax39.legend(bbox_to_anchor=(1.1,0), loc='lower left',borderaxespad=0)
dbscan #cluster: (15, 0.5636228880232954, 0.2221475, 0.2546370694510583)
dbscan #cluster: (16, 0.5900239531436895, 0.1379021, -0.00010274599883232464)
dbscan #cluster: (13, 0.8649845690058457, 0.31939077, 0.1055945479518415)
dbscan #cluster: (11, 0.275921197155445, 0.028159346, 0.05504964640899667)
dbscan #cluster: (17, 0.6417390020086863, 0.18170966, 0.16409262241445435)
dbscan #cluster: (16, 0.4168913932776287, 0.120220825, 0.1707593957742713)
dbscan #cluster: (18, 0.6525928913579754, 0.23479128, 0.16105626198417755)
dbscan #cluster: (9, 0.1744847050560463, -0.19420482, 0.058179233983350315)
dbscan #cluster: (13, 0.8809936992783869, 0.3629963, 0.08767316636623741)
dbscan #cluster: (23, 0.3951209986570868, 0.16815323, 0.16338318406220362)
dbscan #cluster: (13, 0.8815427838061656, 0.41062963, 0.08800324905681522)
dbscan #cluster: (13, 0.36971893997082955, 0.5694112, 0.056188304372012964)
dbscan #cluster: (9, 0.8465862588128682, 0.49368003, 0.10602769193133729)
dbscan #cluster: (23, 0.38619918767773365, 0.35891145, 0.15722944892046353)
dbscan #cluster: (20, 0.8853505366023374, 0.19490238, 0.08420347739365694)
dbscan #cluster: (17, 0.3833050001838196, -0.040053565, 0.025543782151828662)
dbscan #cluster: (11, 0.8591600613258348, 0.28344175, 0.08360387497753542)
dbscan #cluster: (18, 0.4689050372594872, 0.54075253, 0.2067700983187857)
dbscan #cluster: (16, 0.6500604562976972, 0.29393634, 0.16660039419207825)
dbscan #cluster: (18, 0.3875650052010701, 0.3605602, 0.2061783374345536)
<matplotlib.legend.Legend at 0x7f55965a4c10>

